. 2021 Jan 27;10:e63055. doi: 10.7554/eLife.63055

Figure 11. Data (black) and posterior predictive distribution of the RL-ARD (blue), separately for each difficulty condition.

Column titles indicate the magnitude and difficulty condition. Top row depicts accuracy over trial bins. Middle and bottom rows show 10th, 50th, and 90th RT percentiles for the correct (middle row) and error (bottom row) response over trial bins. The error responses are collapsed across distractors. Shaded areas correspond to the 95% credible interval of the posterior predictive distributions. All data and fits are collapsed across participants.

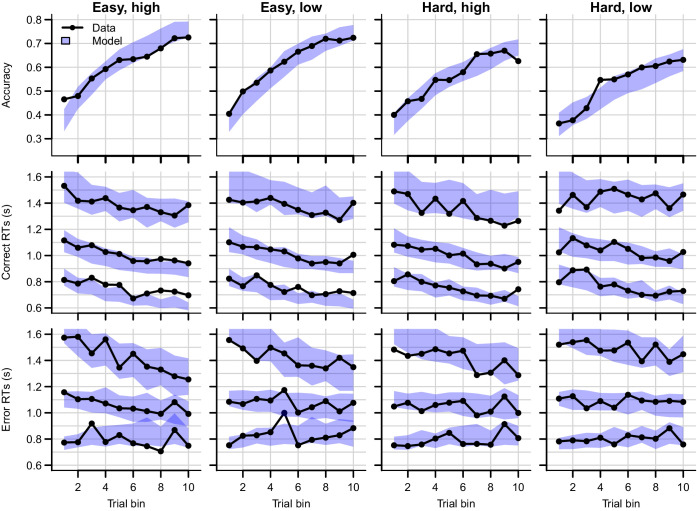
Figure 11.

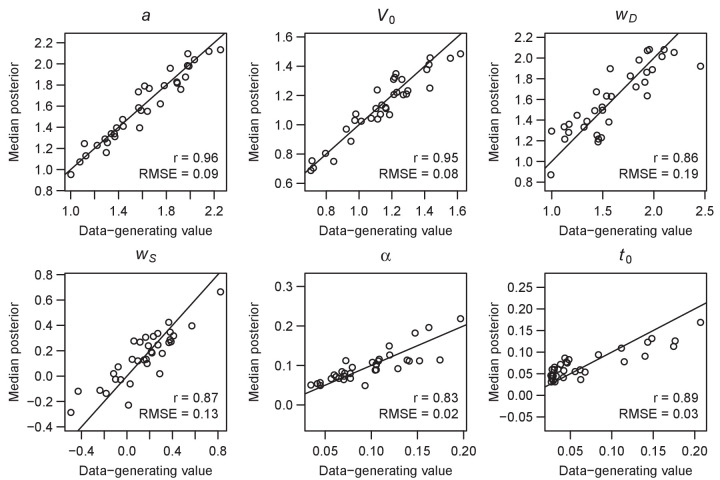
Figure 11—figure supplement 1. Parameter recovery of the multi-alterative Win-All RL-ARD model, using the experimental paradigm of experiment 4.

Figure 11—figure supplement 1.

Parameter recovery was done by first fitting the RL-ARD model to the empirical data, and then simulating the exact same experimental paradigm (34 subjects, 4 conditions, 432 trials) using the median parameter estimates obtained from the model fit. Subsequently, the RL-ARD was fit to the simulated data. The median posterior estimates (y-axis) are plotted against the data-generating values (x-axis). Pearson’s correlation coefficient r and the root mean square error (RMSE) are shown in each panel. Diagonal lines indicate the identity x = y.
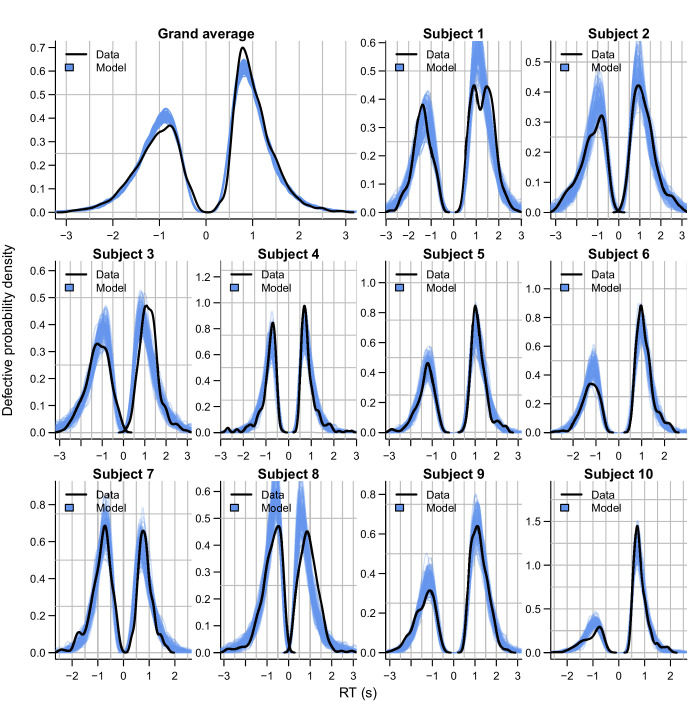
Figure 11—figure supplement 2. Empirical (black) and posterior predictive (blue) defective probability densities of the RT distributions of experiment 4, estimated using kernel density approximation.

Figure 11—figure supplement 2.

Negative RTs correspond to error choices, collapsed across the two distractor choice options. Blue lines represent 100 posterior predictive RT distributions from the RL-ARD model. The grand average is the RT distribution across all trials and subjects, subject-wise RT distributions are across all trials per subject for the first 10 subjects, for which the quality of fit was representative for the entire dataset.
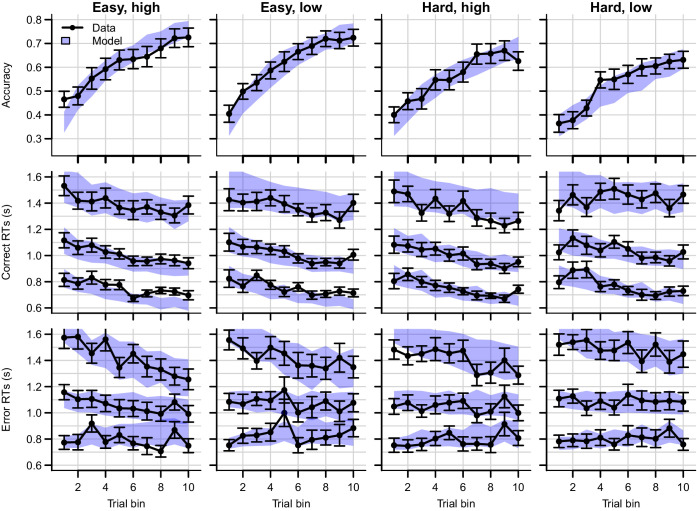
Figure 11—figure supplement 3. Data (black) and posterior predictive distribution of the RL-ARD (blue), separately for each difficulty condition of experiment 4.

Figure 11—figure supplement 3.

Column titles indicate the magnitude and difficulty condition. Top row depicts accuracy over trial bins. Middle and bottom rows show 10th, 50th, and 90th RT percentiles for the correct (middle row) and error (bottom row) response over trial bins. The error responses are collapsed across distractors. Shaded areas correspond to the 95% credible interval of the posterior predictive distributions. All data and fits are collapsed across participants. Error bars depict standard errors.