. 2021 Jan 27;10:e63055. doi: 10.7554/eLife.63055

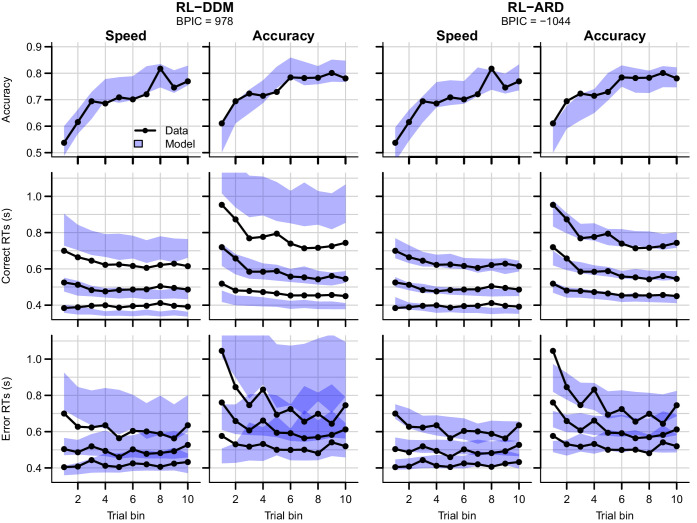
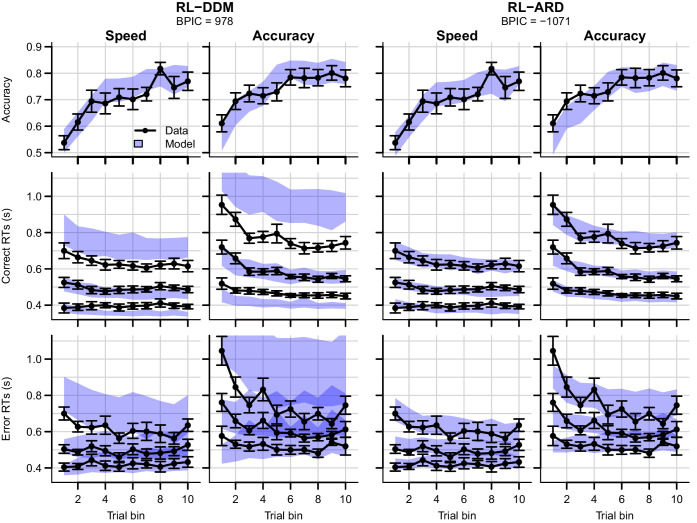
Figure 6. Data (black) and posterior predictive distributions (blue) of the best-fitting RL-DDM (left columns) and the winning RL-ARD model (right columns), separate for the speed and accuracy emphasis conditions.

Top row depicts accuracy over trial bins. Middle and bottom row show 10th, 50th, and 90th RT percentiles for the correct (middle row) and error (bottom row) response over trial bins. Shaded areas in the middle and right column correspond to the 95% credible interval of the posterior predictive distribution.

Figure 6.

Figure 6—figure supplement 1. Data (black) of experiment 2 and posterior predictive distribution (blue) of the RL-DDM A3 with separate thresholds for the SAT conditions, and between-trial variabilities in drift rates, start points, and non-decision times.

Figure 6—figure supplement 1.

The corresponding summed BPIC was -861, an improvement over the RL-DDM, but outperformed by the RL-ARD (ΔBPIC=232 in favor of the RL-ARD). Top row depicts accuracy over trial bins. Middle and bottom row illustrate 10th, 50th, and 90th quantile RT for the correct (middle row) and error (bottom row) response over trial bins. Left and right column are speed and accuracy emphasis condition, respectively. Shaded areas correspond to the 95% credible interval of the posterior predictive distributions.
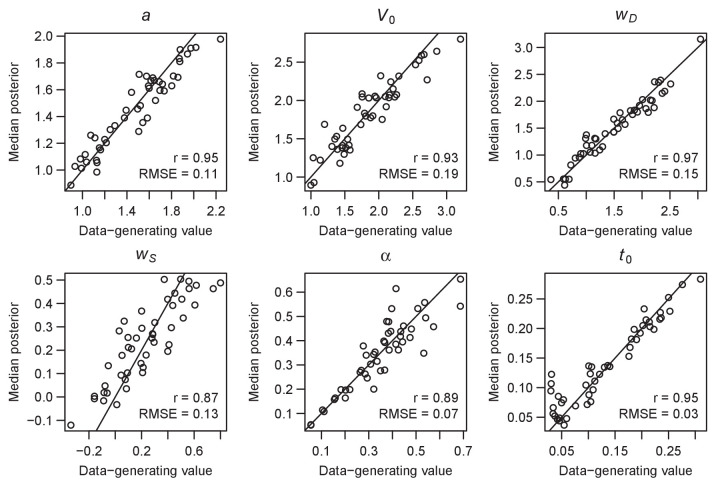
Figure 6—figure supplement 2. Parameter recovery of the RL-ARD model, using the experimental paradigm of experiment 2.

Figure 6—figure supplement 2.

Parameter recovery was done by first fitting the RL-ARD model to the empirical data, and then simulating the exact same experimental paradigm (19 subjects, three difficulty conditions, 2 SAT conditions, 312 trials) using the median parameter estimates obtained from the model fit. Subsequently, the RL-ARD was fit to the simulated data. The median posterior estimates (y-axis) are plotted against the data-generating values (x-axis). Pearson’s correlation coefficient r and the root mean square error (RMSE) are shown in each panel. Diagonal lines indicate the identity x = y.
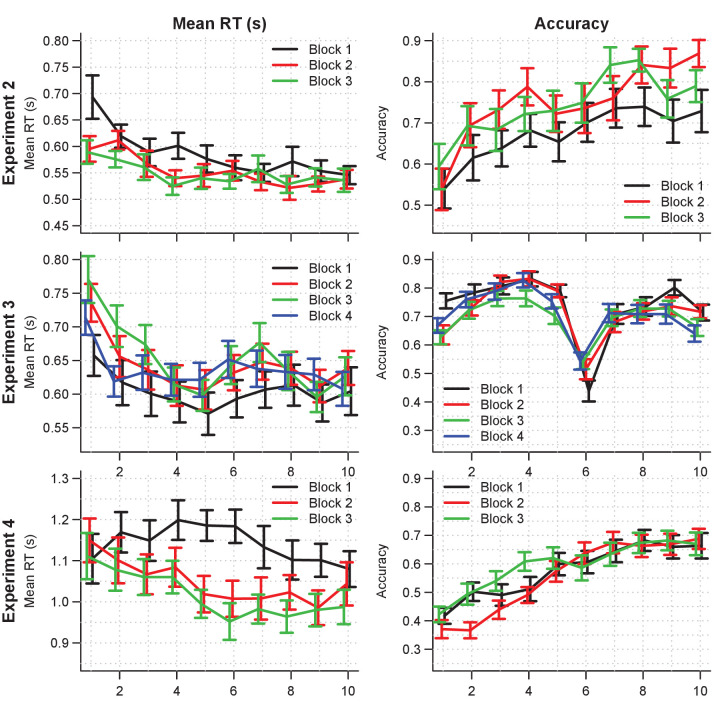
Figure 6—figure supplement 3. Mean RT (left column) and choice accuracy (right column) across trial bins (x-axis) for experiments 2 and 3 (rows).

Figure 6—figure supplement 3.

Block numbers are color-coded. Error bars are 1 SE. Mixed effects models indicated that in experiment 2, RTs decreased with block number (b = −0.04, SE = 6.15*10−3, 95% CI [−0.05,–0.03], p = 6.61*10−10) as well as with trial bin (b = −0.02, SE = 2.11*10−3, 95% CI [−0.02,–0.01], p = 1.68*10−13), and there was an interaction between trial bin and block number (b = 3.61*10−3, SE = 9.86*10−4, 95% CI [0.00, 0.01], p = 2.52*10−4). There was a main effect of (log-transformed) trial bin on accuracy (on a logit scale; b = 0.36, SE = 0.11, 95% CI [0.15, 0.57], p = 7.99*10−4), but no effect of block number, nor an interaction between block number and trial bin on accuracy. In experiment 3, response times increased with block number (b = 0.02, SE = 3.10*10−3, 95% CI [0.01, 0.02], p = 1.21*10−7), decreased with trial bin (b = −4.24*10−3, SE = 1.37*10−3, 95% CI [−6.92*10−3, −1.56*10−3], p = 0.002), but there was no interaction between trial bin and block number (b = −9.15*10−4, SE = 5*10−4, 95% CI [0.00, 0.00], p = 0.067). The bottom left panel suggests that the main effect of block number on RT is largely caused by an increase in RT after the first block. Accuracy decreased with (log-transformed) trial bin (on a logit scale: b = −0.12, SE = 0.05, 95% CI [−0.22,–0.02], p = 0.02), decreased with block number (b = −0.08, SE = 0.03, 95% CI [−0.14,–0.02], p = 0.009), but there was no interaction (b = 0.02, SE = 0.02, 95% CI [−0.02, 0.06], p = 0.276). The decrease in accuracy with trial bin is expected due to the presence of reversals. The combination of an increase in RT and a decrease in accuracy after the first block could indicate that participants learnt the structure of the task (i.e. the presence of reversals) in the first block, and adjusted their behavior accordingly. In line with this speculation, the accuracy in trial bin 6 (in which the reversal occurred) was lowest in the first block, which suggests that participants adjusted to the reversal faster in the later blocks. In experiment 4, response times decreased with block number (b = −0.04, SE = 9.08*10−3, 95% CI [−0.06,–0.02], p = 3.19*10−3) and there was an interaction between block number and trial bin (b = −4.31*10−3, SE = 1.45*10−3, 95% CI = [−0.01, 0.00], p = 0.003), indicating that the decrease of RTs over trial bins was larger for the later blocks. There was no main effect of trial bin on RTs. There was a main effect of (log-transformed) trial bin on accuracy (on a logit scale: b = 0.60, SE = 0.07, 95% CI [0.47, 0.73], p < 10-16), but no main effect of block and no interaction between block and trial bin.
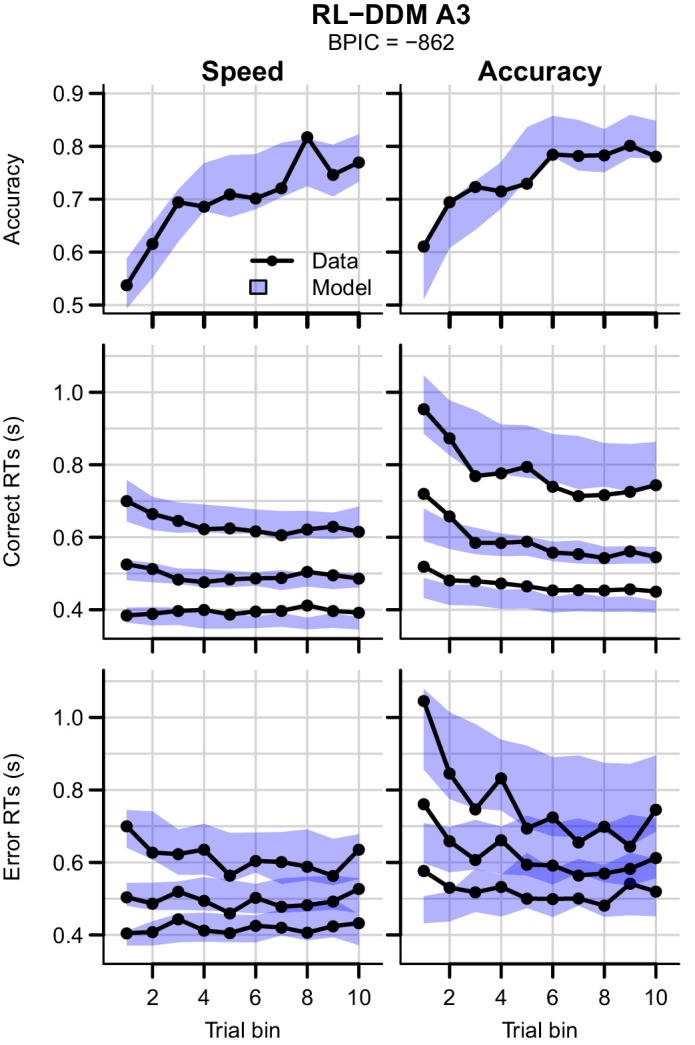
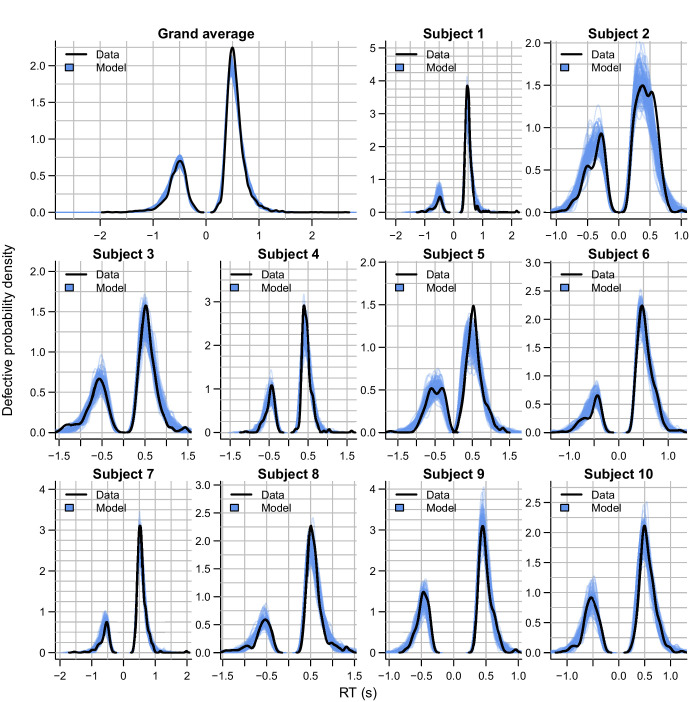
Figure 6—figure supplement 4. Empirical (black) and posterior predictive (blue) defective probability densities of the RT distributions of experiment 2, estimated using kernel density approximation.

Figure 6—figure supplement 4.

Negative RTs correspond to error RTs. Blue lines represent 100 posterior predictive RT distributions from the RL-ARD model. The grand average is the RT distribution across all trials and subjects, subject-wise RT distributions are across all trials per subject for the first 10 subjects, for which the quality of fit was representative for the entire dataset.
Figure 6—figure supplement 5. Data (black) and posterior predictive distributions (blue) of the best-fitting RL-DDM (left columns) and the winning RL-ARD model (right columns), separate for the speed and accuracy emphasis conditions.

Figure 6—figure supplement 5.

Top row depicts accuracy over trial bins. Middle and bottom row show 10th, 50th, and 90th RT percentiles for the correct (middle row) and error (bottom row) response over trial bins. Shaded areas in the middle and right column correspond to the 95% credible interval of the posterior predictive distribution. Error bars depict standard errors.