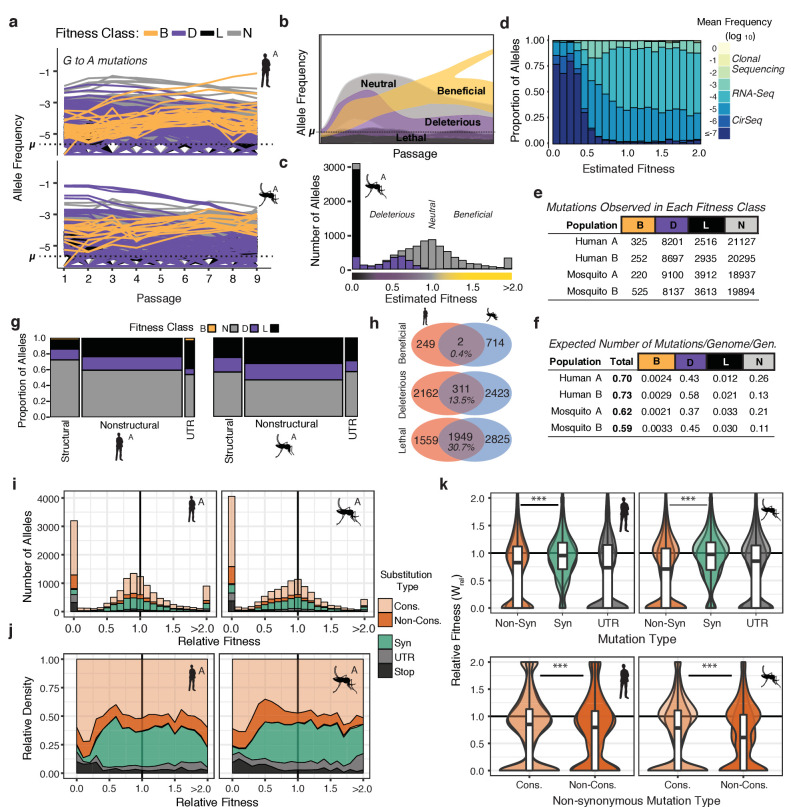
Figure 3. The distribution of fitness effects reveals patterns of evolutionary constraint.
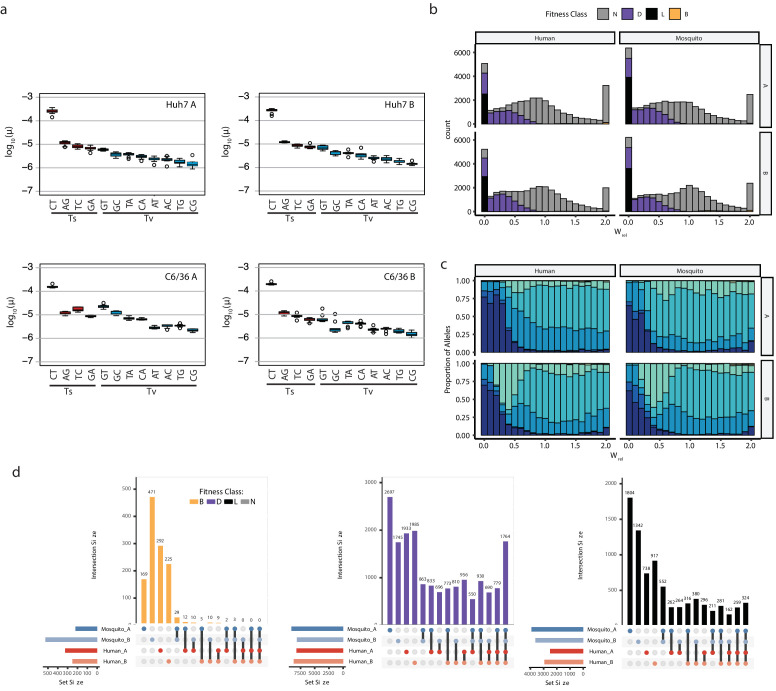
(a) The frequency trajectories for G-to-A mutations in the adapting populations determined by CirSeq. Colors represent the classification of each allele as beneficial, deleterious, lethal, or neutral (not statistically distinguishable from neutral behavior) (b) Schematic illustrating the expected frequency behavior of specific fitness classes relative to their corresponding mutation rate, µ. Changes in allele frequency between passages are used to estimate the fitness effects of individual alleles in the population (see Materials and methods). (c) Histogram showing the distribution of mutational fitness effects (DMFE) of DENV passaged in mosquito cells. The data shown are from mosquito A and represent the high confidence set of alleles (see text). The fitness classifications of alleles in each bin, based on their 95% confidence intervals, is indicated by the fill color. (d) The relative density of each mutation type across the fitness spectrum illustrates the sequencing depth necessary to observe regions of the fitness spectrum. Fill color represents the average frequency of the mutation over passage. (e) Tabulation of all alleles by fitness class. (f) Estimate of the genomic mutation rate per genome per generation ('Total'), and fitness class-specific mutation rates ('B', 'D', 'N', and 'L', Supplementary file 2). (g) Area plot showing the fitness effects associated with mutations in structural, non-structural, and UTR regions of the DENV genome. The relative width of the columns indicates the number of alleles in each class, the relative height of the colored regions indicates the proportion of alleles of a given class. (h) Venn diagrams showing the number of mutations identified as beneficial, deleterious, or lethal in the high confidence set alleles (see Materials and methods). These counts include alleles identified in either A or B replica populations. (i) Histograms of the DMFE broken down by mutation type. (j) Density plot of the relative density of mutation types across the DMFE to emphasize the local enrichment of specific classes. (k) Violin plots showing the relative fitness of nonsynonymous and synonymous mutations, and those in the viral UTRs. Overlapping plots are shown for replicates A and B for each host. Boxplots are computed based on the DMFE of both replica lineages in each host. Nonsynonymous mutations can further be partitioned into conservative and non-conservative classes.


