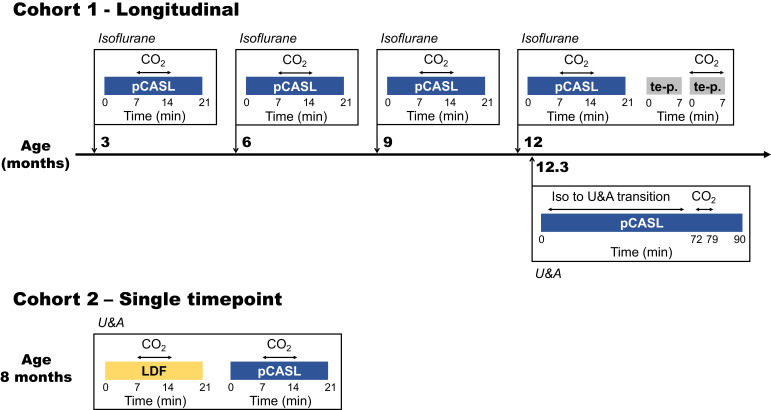
Figure 1. Study design.
Two different cohorts were used in this study, of which the first was followed longitudinally. The timeline of the first cohort is illustrated in the upper part of the figure, with scan moments indicated with orthogonal arrows projected onto the time line. The most relevant scans performed at these moments are indicated within the boxes adjoined to the orthogonal arrows and the type of anesthesia used is indicated in italics on top of the boxes. The lower part of the figure illustrates the single time point measurements performed in cohort 2. pCASL = pseudo-continuous arterial spin labeling; te p. = time-encoded pseudo-continuous arterial spin labeling; U and A = urethane and α-chloralose; LDF = laser Doppler flowmetry.

