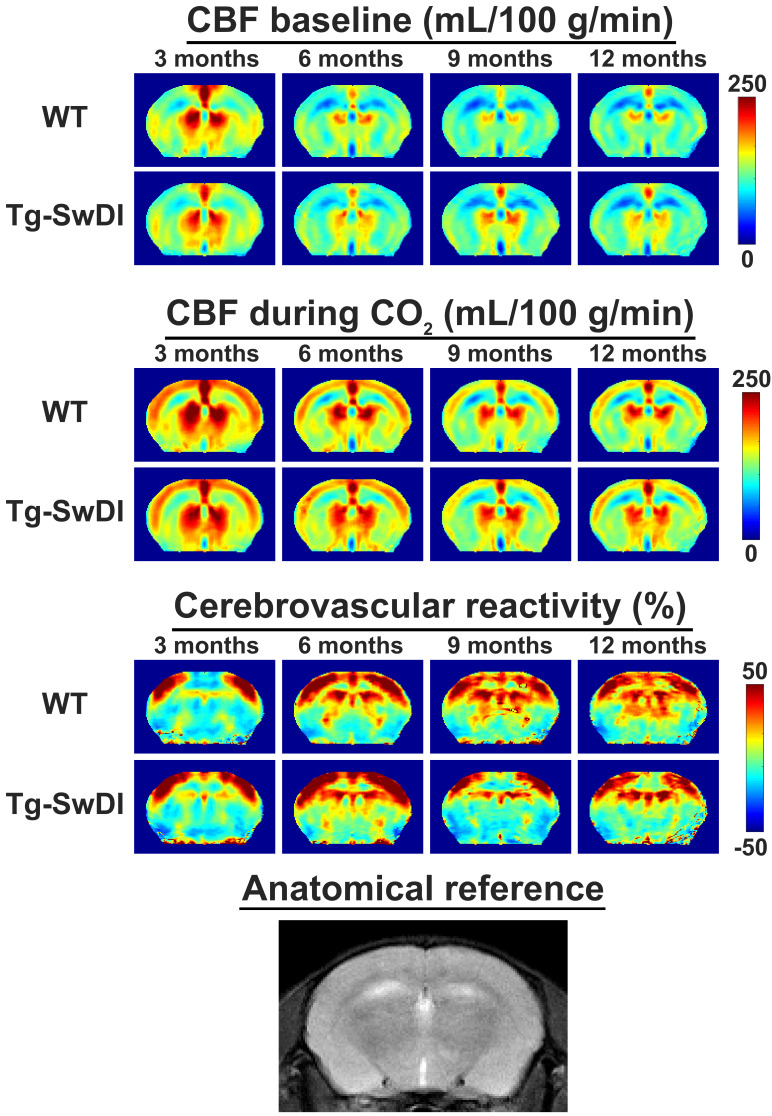
Figure 2. Average mid-brain cerebral blood flow (CBF) and cerebrovascular reactivity (CVR) maps for wild-type (WT) and transgenic Swedish Dutch Iowa (Tg-SwDI) mice in cohort 1.
From left to right, the different ages are displayed. From top to bottom, respectively CBF maps at baseline, CBF maps during CO2, and CVR maps are displayed, with WT and Tg-SwDI mice alternating per row. On the bottom row, an anatomical magnetic resonance imaging (MRI) scan of the same brain slice is shown. Note that the CBF increase during the CO2 challenge is most profound in the cortex, and that the WT and Tg-SwDI mice show similar CBF and CVR maps.

