. 2021 Feb 12;10:e61279. doi: 10.7554/eLife.61279

Figure 5. Cerebral blood flow (CBF) and cerebrovascular reactivity (CVR) acquired during isoflurane anesthesia and urethane and α-chloralose (U and A) anesthesia.

(A) 21-min CBF time profiles acquired in the mid-brain in wild-type (WT) and transgenic Swedish Dutch Iowa (Tg-SwDI) mice under either isoflurane anesthesia (left, 12 months old) or U and A anesthesia (right, 10 days later in the same mice). CO2 was administered between minutes 7 and 14. (B) Mid-brain CBF and CVR maps averaged for WT (top) and Tg-SwDI (bottom) mice. Note that the CVR maps during U and A anesthesia are scaled differently than the CVR maps under isoflurane due to the marked difference in CVR. (C) Boxplot representations of the baseline CBF and CVR group values, where dots and circles represent individual mice.

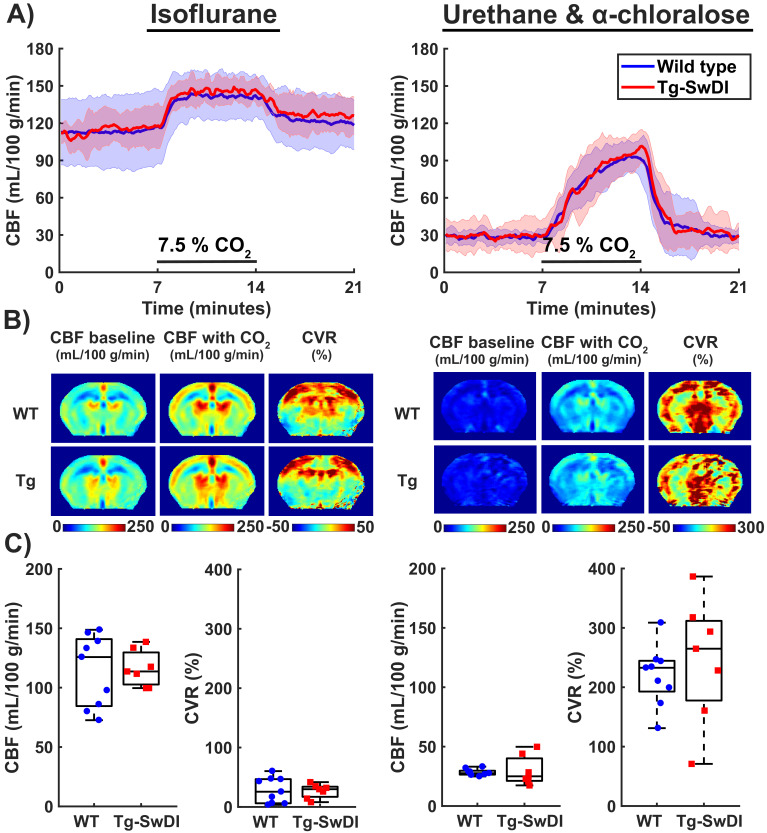
Figure 5.

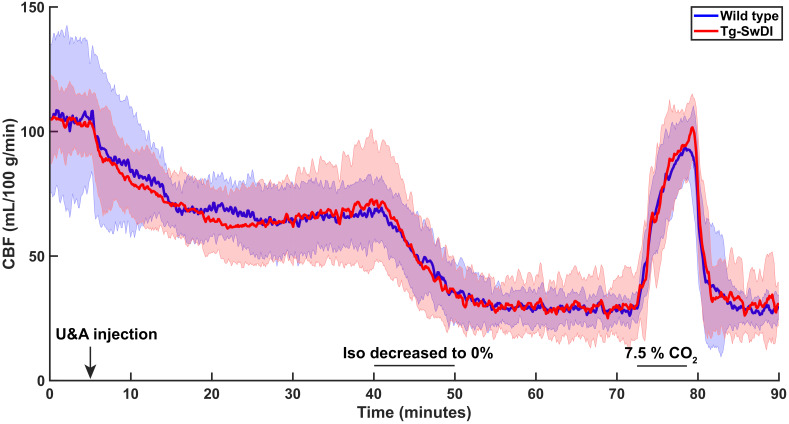
Figure 5—figure supplement 1. Cerebral blood flow (CBF) change observed during switching from isoflurane anesthesia to urethane and α-chloralose (U and A).

Figure 5—figure supplement 1.

90-min CBF time profiles (mean ± standard deviation) are displayed that are acquired in cohort 1 for wild-type and transgenic Swedish Dutch Iowa (Tg-SwDI) mice at an age of 12.3 months. U and A was injected 5 min after the start of the arterial spin labeling-magnetic resonance imaging (MRI) scan. Isoflurane (iso) was decreased between minutes 40 and 50. CO2 was administered between minutes 72 and 79.

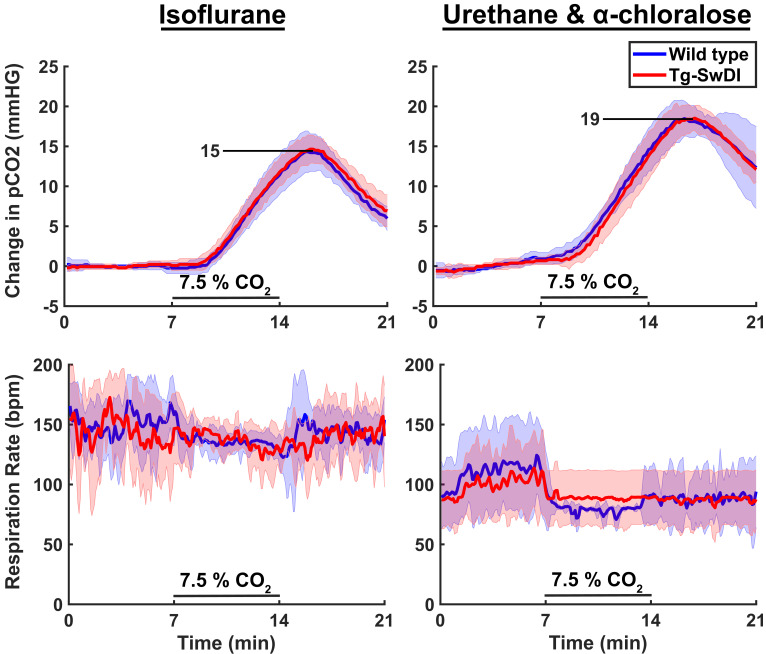
Figure 5—figure supplement 2. Change in transcutaneously measured pCO2 and respiration profiles under different anesthesia protocols.

Figure 5—figure supplement 2.

On the first row, the pCO2 time profiles (mean ± standard deviation) acquired during the pseudo-continuous arterial spin labeling (pCASL) scans are displayed for both wild-type (WT) and transgenic Swedish Dutch Iowa (Tg‑SwDI) mice in the last two time-points of cohort 1, with the acquisition under isoflurane on the left, the acquisition under urethane and α-chloralose on the right. On the second row, the respiration profiles (mean ± standard deviation) for the same time-points are displayed.