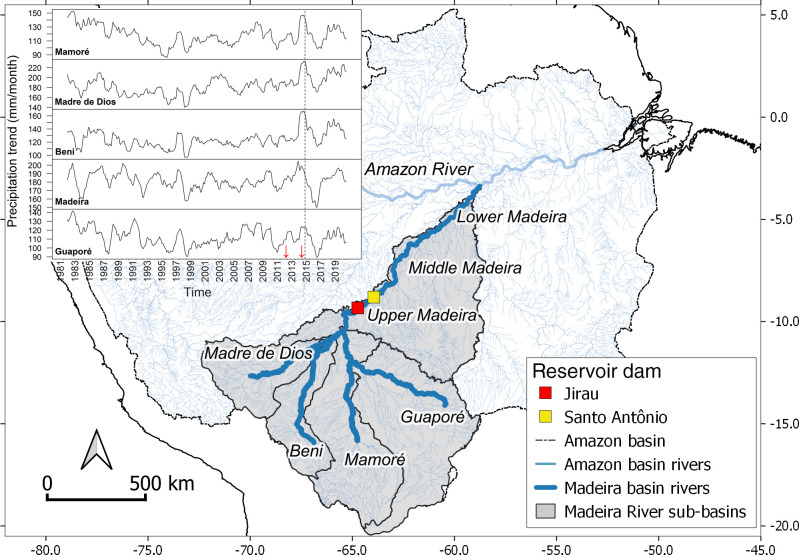
Fig 1. Study area in the Amazon basin highlighting the hydrographic basins of the Madeira River and its main tributaries, as well as the location of Jirau and Santo Antônio mega-dams.
The inset on the map shows the precipitation trend in each sub-basin (upper, middle and lower sections of the Madeira River were grouped) based on data from the global rainfall dataset CHIRPS [31]. Red arrows represent the dates of the filling of Santo Antônio (September 2011) and Jirau (November 2013) reservoirs; the vertical dotted line indicates the peak of flooding at Porto Velho-RO, Brazil (April 2014). The limit of the Amazon basin and the hydrographic network were obtained from [32] and are openly shared datasets, without restriction, in accordance with the EOSDIS Data Use Policy, and the coastline was provided by The World Bank with data licensed by CC-BY4.0.

