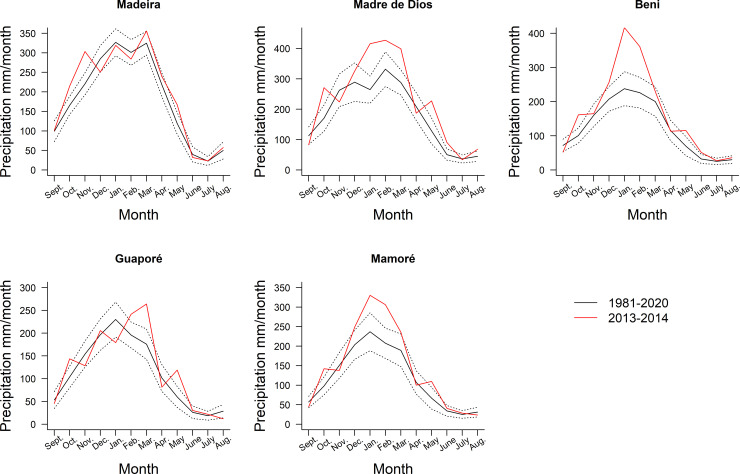
Fig 2.
Monthly average rainfall (black line) ± standard deviation (dotted line) on Madeira River Sub-basins between September/1981-August/2019. Monthly rainfall associated with the extreme 2014 flood period from September/2013 to August/2014 is denoted by the red line, in the hydrographic basins of the Madre de Dios, Beni, Mamoré, Guaporé and Madeira Rivers. Data source: CHIRPS v2.0 [1, 31] (https://www.chc.ucsb.edu/data/chirps).

