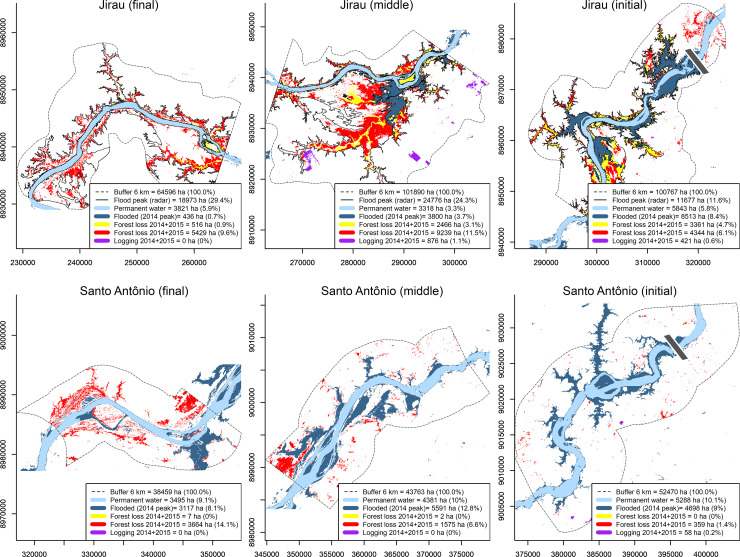
Fig 4. Landscape sections in the area affected by the Jirau and Santo Antônio reservoirs (final, middle and initial sections), the two mega-dams on the Madeira River.
Effects of the 2014 extreme flood are indicated. Diagrams show the 6-km-wide buffer (Buffer) on each bank along the course of the river, percentage of permanent surface water (Permanent water), flooded area at the peak of 2014 extreme flood (Flooded) visible by optical sensors (Landsat), flooded area peak along the Jirau reservoir estimated by radar sensor is denoted by the black line (data provided by Energia Sustentável do Brasil, ESBR) is denoted by black line, forest loss two years after flooding (2014+2015), highlighting forest loss from filling the reservoirs (yellow) and the loss of forest of unforeseen areas beyond the predicted limits of the reservoirs (red). Deforestation by logging, which was not considered in the calculations of forest loss caused by flood, are shown in purple. Percentage of forest loss is relative to the total area of forest cover in 2013 before flooding. Location of dams are indicated by grey bars. Additional analyzed buffers are presented in S1 Appendix. Permanent superficial water and flooded area data from EC JRC/Google [35]. Forest loss data from Hansen/UMD/Google/USGS/NASA [36].

