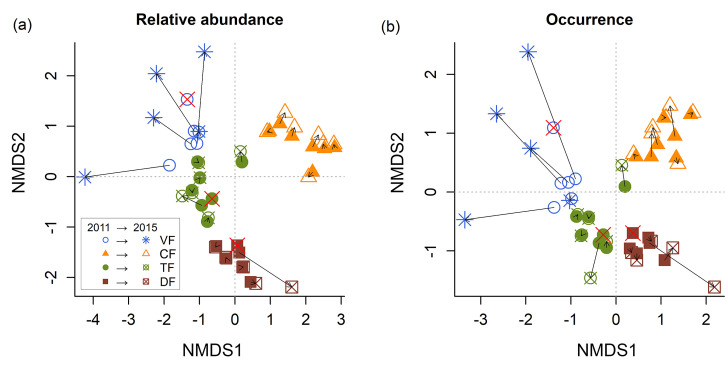
Fig 6.
Non-metric dimensional scaling (NMDS) based on relative abundance (a) and species occurrence (b). Arrows indicates the trajectory of 26 plots sampled before (2011) and after (2015) filling the Jirau hydroelectric dam in the Madeira River basin. TF = terra firme forests, DF = transitional forests, V = várzea forests, CF = campinarana forests. Plots with total mortality in 2015 are denoted with a red “×”. For these plots, only 2011 scores are shown.

