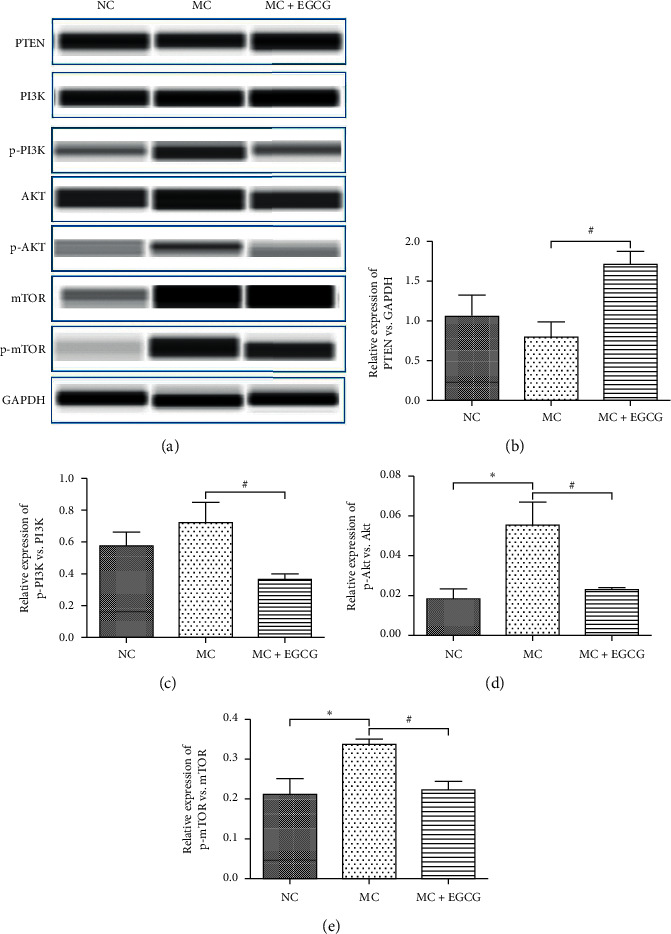
Figure 6.

The effect of EGCG on the protein expressions of PTEN, PI3K, Akt, and mTOR. The protein expression of PTEN (a, b) in the MC group decreased compared with that in the NC group, while it increased after EGCG treatment. The protein expressions of PI3K (a, c), Akt (a, d), and mTOR (a, e) in the MC group increased compared with that in the NC group, while they decreased after EGCG treatment. Data are expressed as mean ± SEM. ∗P < 0.05 versus the NC group. #P < 0.05 versus the MC group.
