. 2021 Jan 3;35(1):249–257. doi: 10.21873/invivo.12253

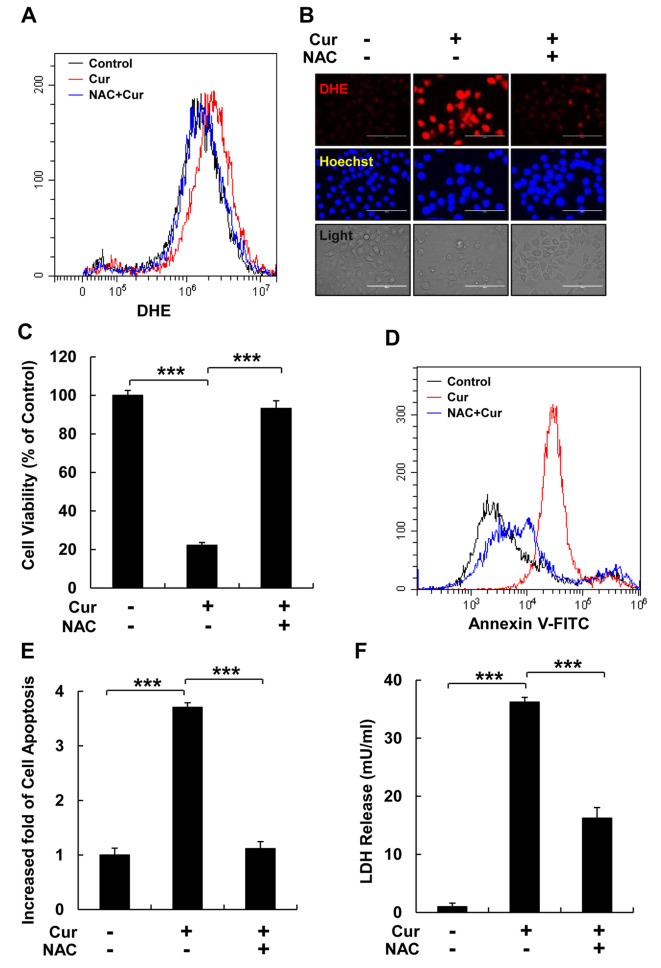
Figure 3. ROS inhibition reduces cellular apoptosis and LDH release. HepG2 cells were pre-treated with NAC, a ROS scavenger, for 30 min. (A) Cellular ROS levels were detected using flow cytometry with DHE staining. Black: no treatment; red: curcumin treatment; blue: NAC pretreatment and curcumin treatment. (B) Cellular ROS were detected using a fluorescence micrograph with DHE (red) and Hoechst (blue) staining (scale bar=100 μm). (C) Cell viability was analyzed using an MTT assay. (D) Cellular apoptosis was detected using flow cytometry and Annexin V - FITC staining of HepG2 cells. Black: normal cells; red: curcumin treatment; blue: NAC pretreatment and curcumin treatment. (E) Quantitative analysis of cellular apoptosis shown in (D). (F) LDH production in HepG2 cells following three different treatments, as indicated. Data represent the mean±SEM of three different samples (***p<0.001).

Figure 3