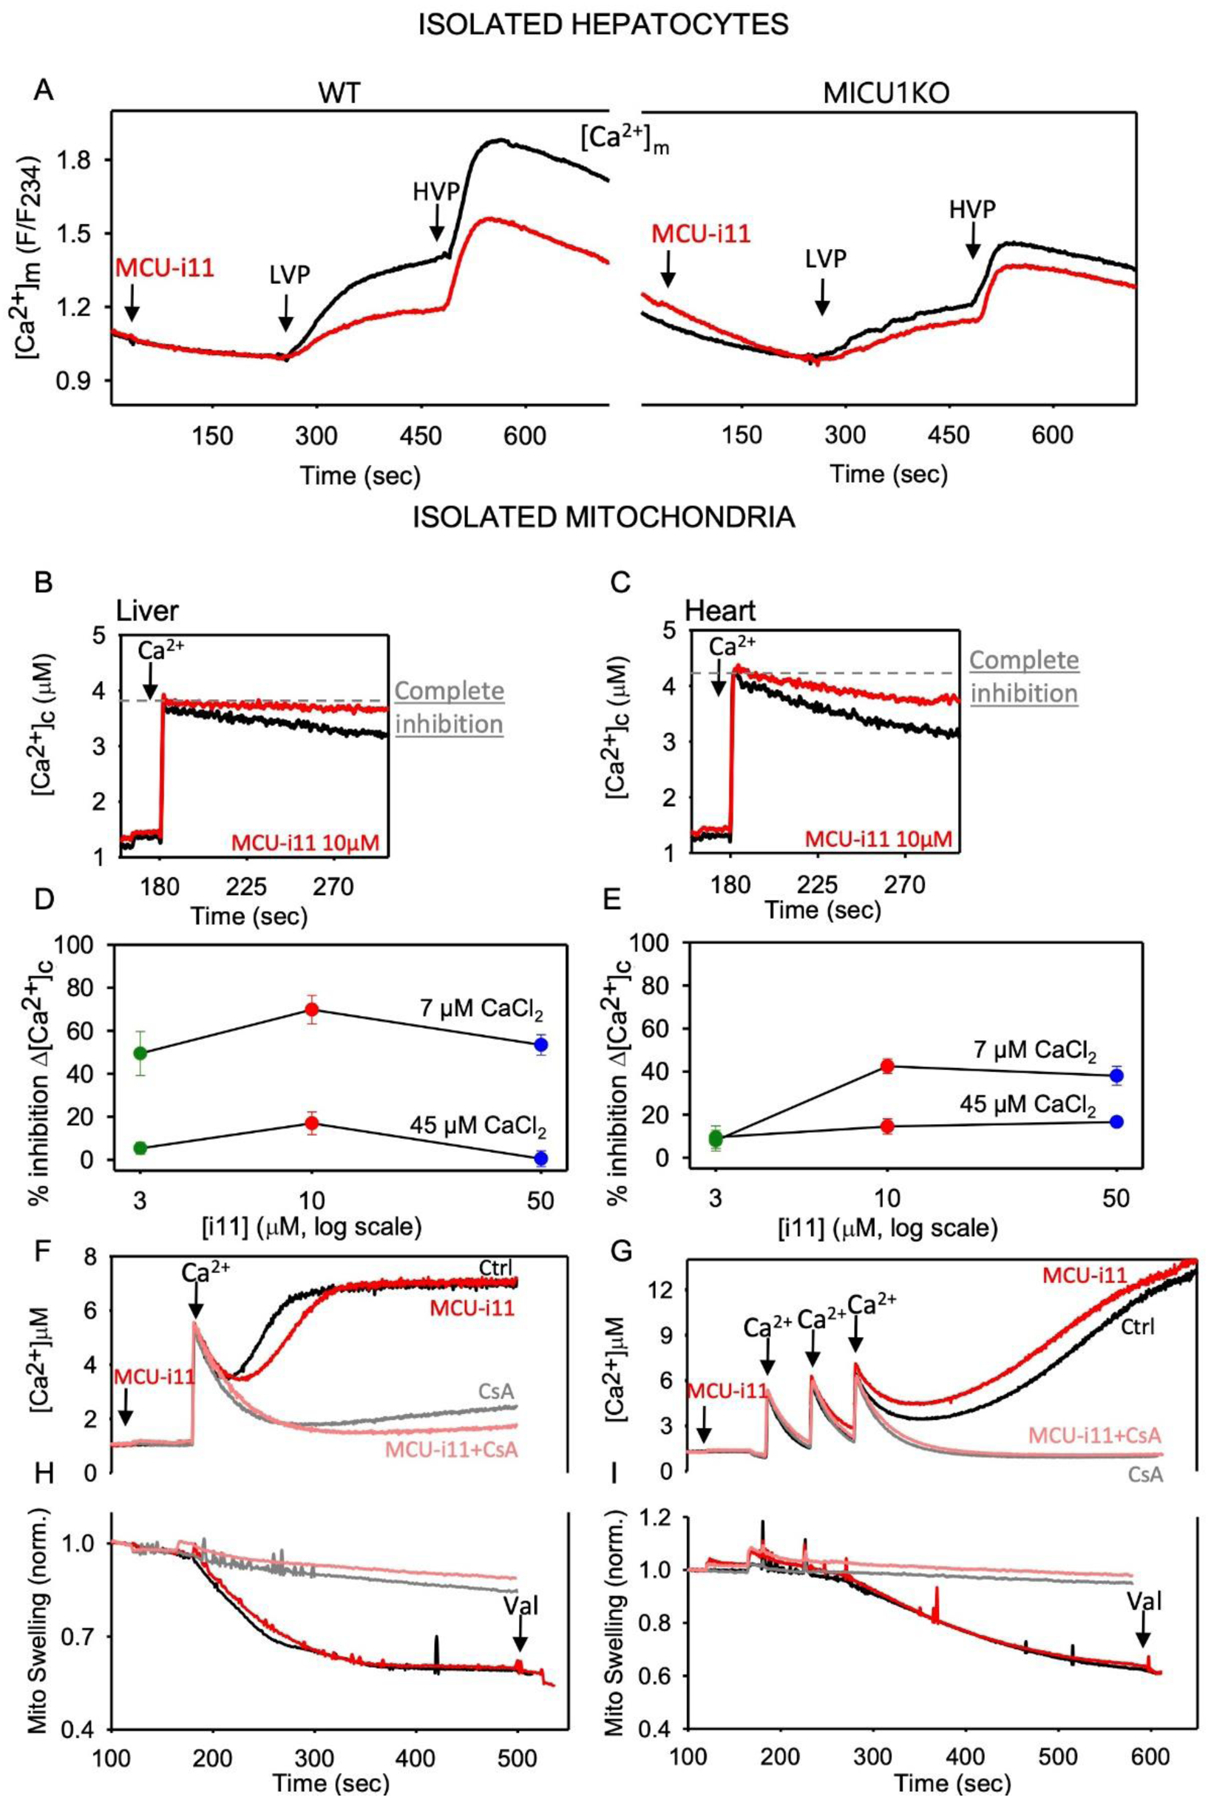
Figure 4. mtCU inhibition by MCU-i11 in liver and heart.

A Mean [Ca2+]m (mtRCaMP) is shown for mouse hepatocytes treated sequentially by a submaximal dose of vasopressin (LVP, 1–1.5nM), and a maximal dose (HVP, 100nM). Measurements were done as described previously [45] n=8 for WT and n=4 for MICU1KO. Baseline subtracted highest value of [Ca2+]m was calculated for each condition and compared to each other by Two-way ANOVA test (Mean±SEM). MCU-i11 significantly decreased the [Ca2+]m peak in WT (0.99±0.035 vs. 0.65±0.032, p<0.001) and failed to alter in MICU1KO (0.53±0.038 vs. 0.43±0.022, p=0.132). BC Clearance of a Ca2+ bolus (7μM CaCl2) was measured in isolated liver (B) and heart (C) mitochondria fluorometrically as described in [23]. DE MCU-i11 dose-response for the inhibition of the initial Ca2+ clearance in liver (D) and heart (E) isolated mitochondria upon 7 or 45μM CaCl2 addition (n=3 for liver, 6 for heart). F mPTP opening in isolated liver mitochondria was visualized as a delayed [Ca2+] increase upon 7μM CaCl2 addition in the absence of Mg-ATP. Traces were recorded without and with MCU-i11, and in the presence of 5μM CsA (inhibitor of mPTP). G In heart mitochondria, mPTP opening elicited by three pulses of 7μM CaCl2 was recorded in the absence and presence of MCU-i11. H&I mPTP opening manifests as mitochondrial swelling as measured by light scattering (side-scatter at 520nm). The Ca2+-induced light scattering decrease was recorded without and with MCU-i11 in liver (H) and heart (I) mitochondria. CsA was used as a positive control both in liver and heart (Mean traces for ≥4 measurements in each condition).
