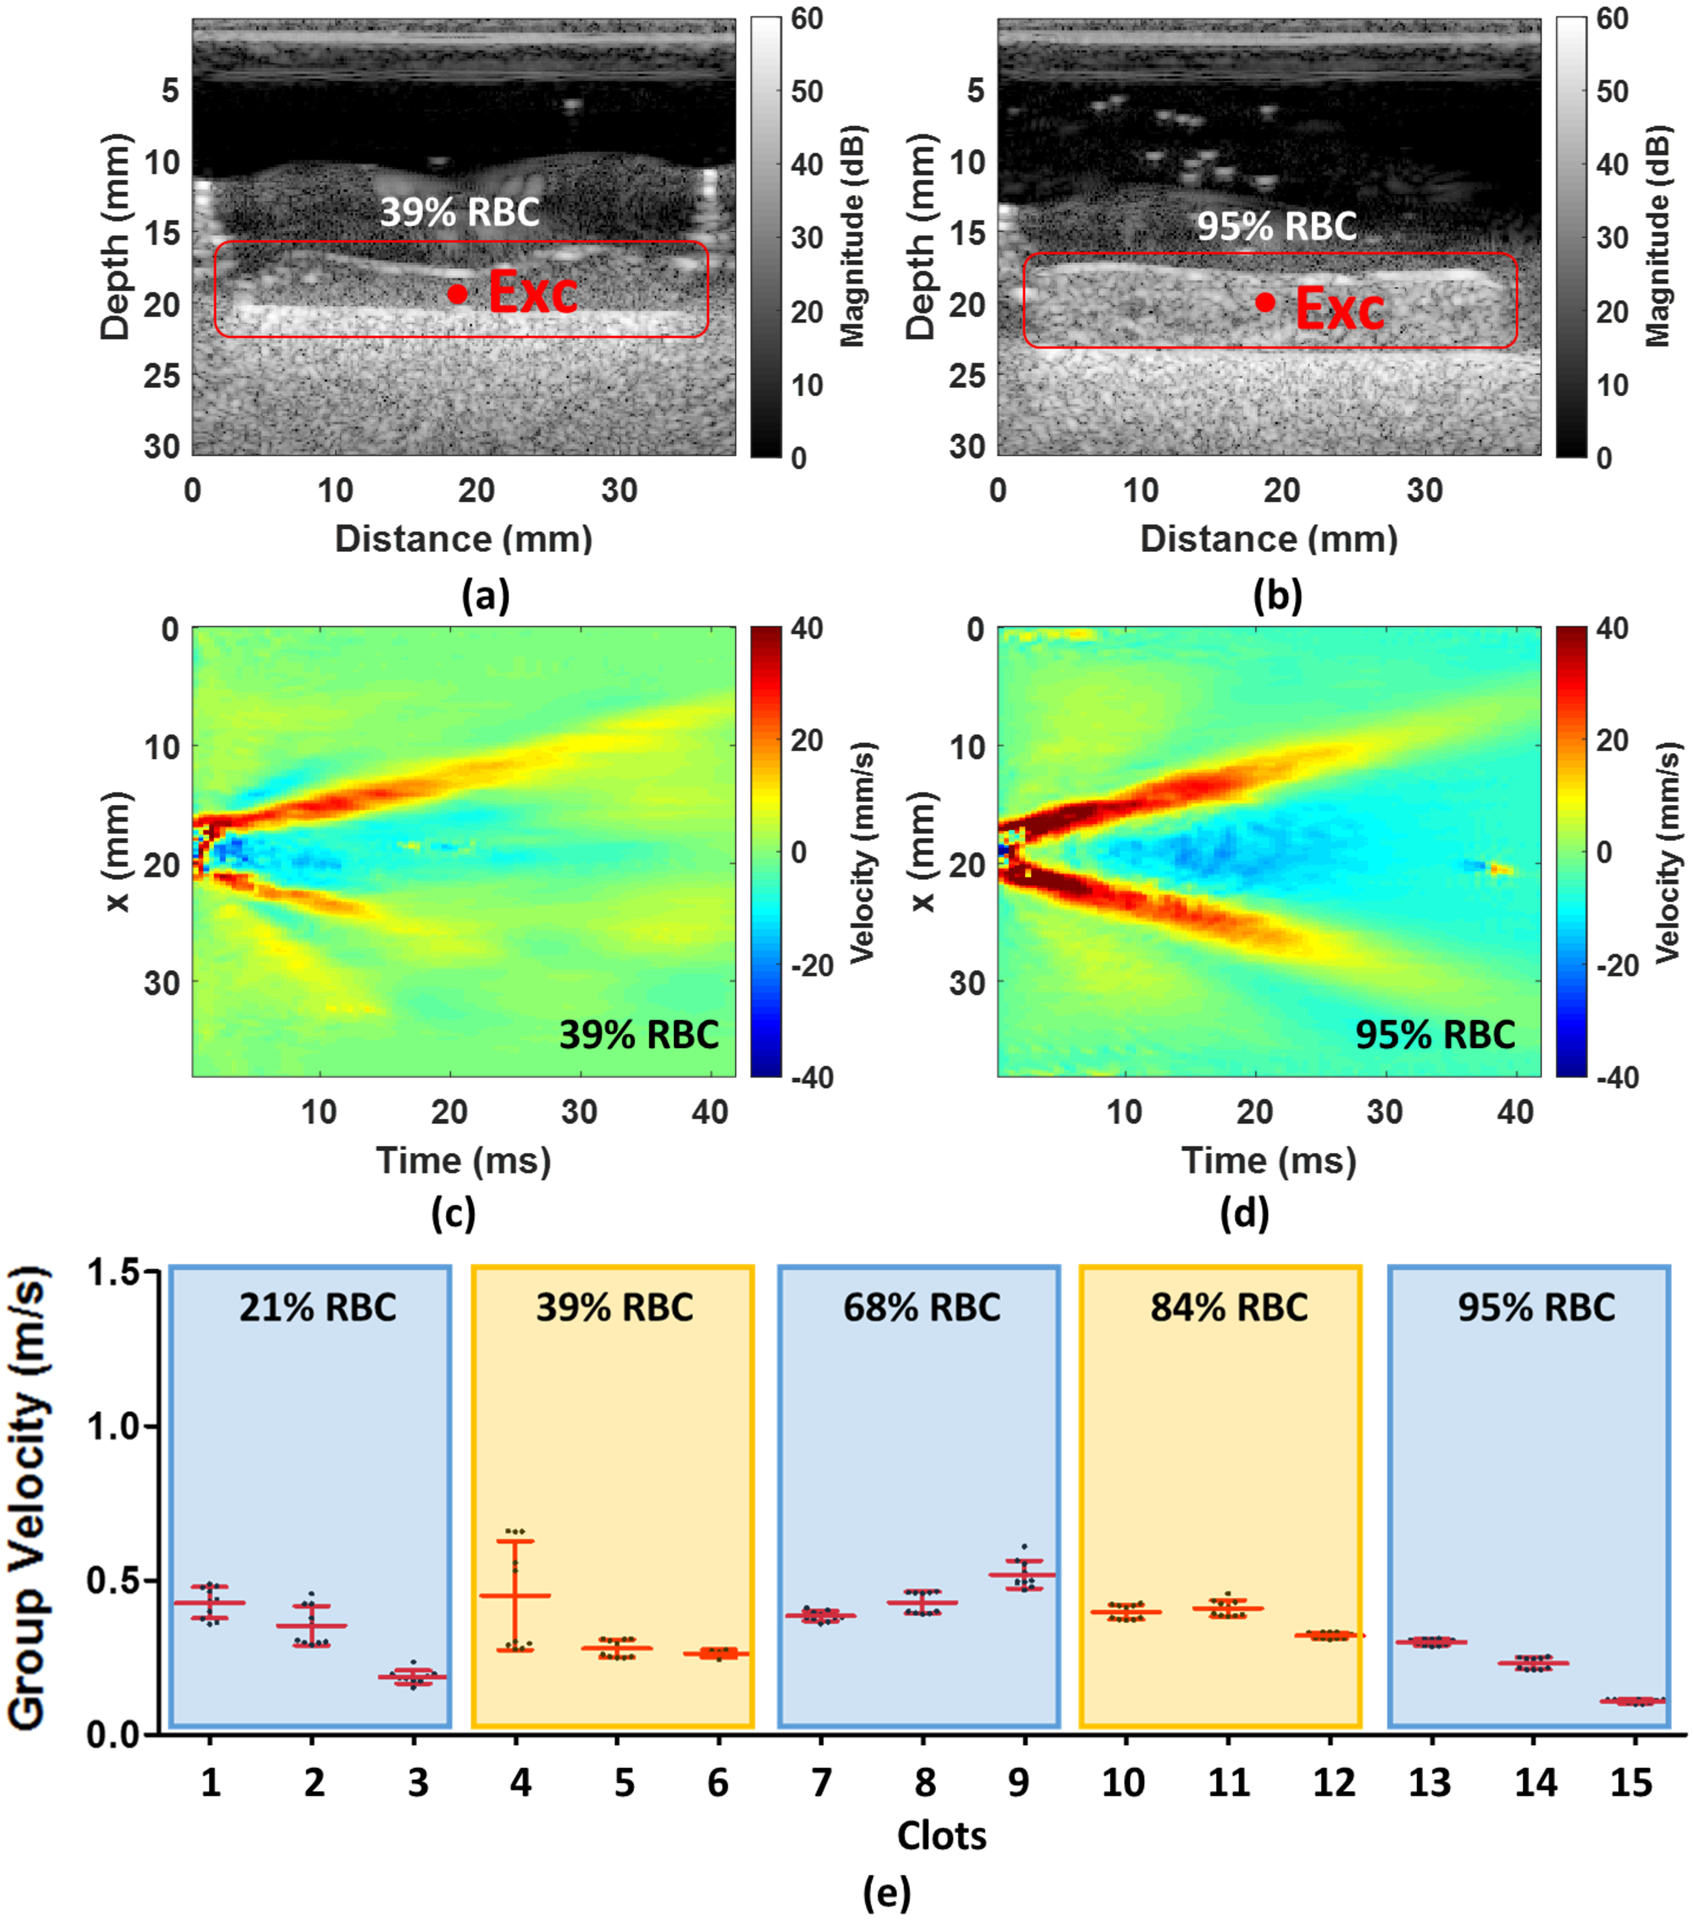
FIG. 6.

(a) and (b) An example shows the 39% and 95% RBC composition of ultrasound B-mode image, respectively. (c) and (d) A 2D a lateral time-peak wave map of wave motion in 39% and 95% RBC composition, respectively. (e) The mean group velocity with their SDs for each RBC composition. The Exc in (a) and (b) denotes the ultrasound excitation location.
