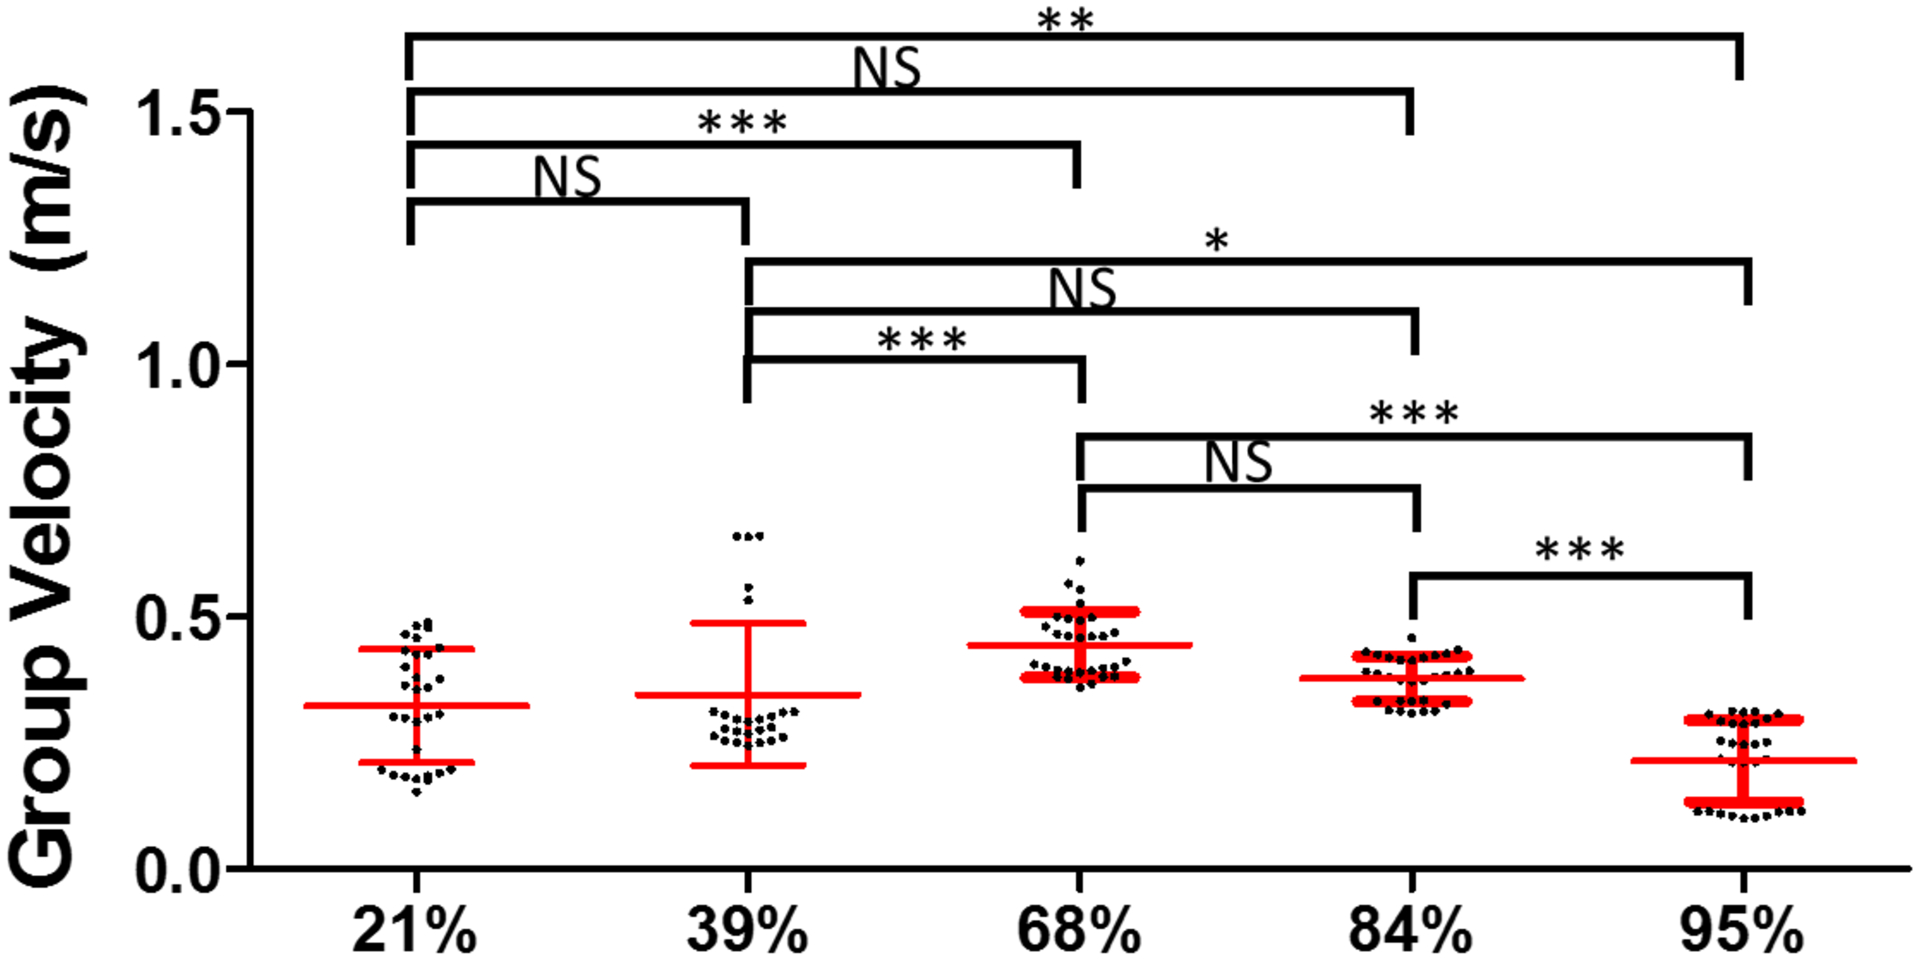
FIG. 7.

The combination of three individual samples for each RBC compositions, measured by SWE. ***, ** and * indicate the p-value < 0.001, < 0.01 and < 0.05, respectively. The notation NS means non-significant (p > 0.05).

The combination of three individual samples for each RBC compositions, measured by SWE. ***, ** and * indicate the p-value < 0.001, < 0.01 and < 0.05, respectively. The notation NS means non-significant (p > 0.05).