
Extended Data Fig. 4. Genomic lesions in PARPi treated ALC1 deficient cells are repaired by SSBR and NHEJ.
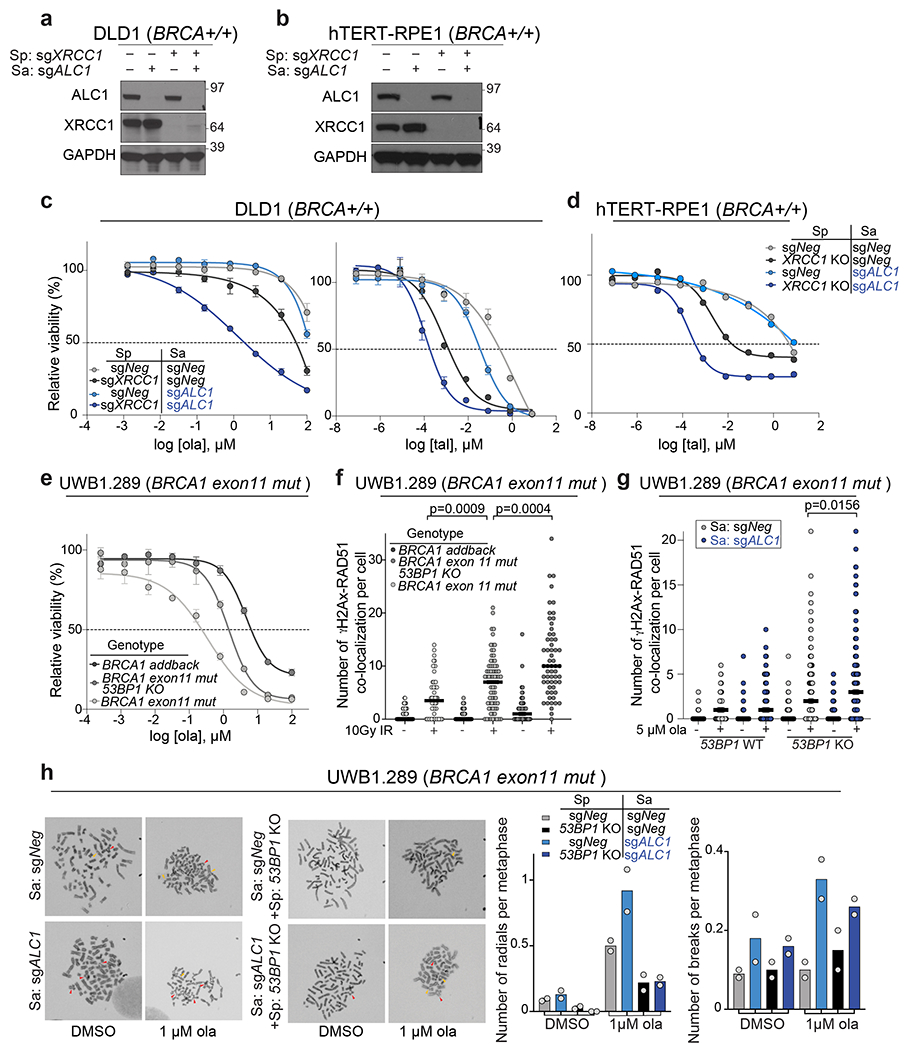
a-b, Immunoblot showing levels of ALC1 and XRCC1 in indicated DLD1 (a) and hTERT-RPE1 (b) cells. The western samples were analyzed once to check the efficiency of the sgRNAs for protein depletion before drug sensitivity assays. c, Sensitivities of the indicated DLD1 cells lines to ola and tal using the CellTiter-Glo assay. Data are mean ± s.e.m. from n = 3 biologically independent experiments. d, Sensitivities of the indicated hTERT-RPE1 cells lines to tal using the CellTiter-Glo assay. Data are mean from n=2 biologically independent experiments. e, Sensitivities of the indicated UWB1.289 cell lines to ola using the CellTiter-Glo assay. Data are mean ± s.e.m. from n = 3 biologically independent experiments. f, Quantification of γH2AX-Rad51 foci in indicated cell lines. Cells were fixed 16 hrs. after treatment with 10 Gy ionizing radiation (IR). Median is indicated. p-value determined by Mann-Whitney was derived from n≥54 cells examined over two biologically independent experiments. g, Quantification of γH2AX-Rad51 foci in indicated cell lines. Cells were treated with 5 μM ola for 24 hrs. before fixation. Median is indicated. p-value determined by Mann-Whitney was derived from n≥114 cells examined over three biologically independent experiments. h, Representative images and quantification of radials (indicated by red arrow heads) and breaks (indicated by yellow arrowheads) in the indicated UWB1.289 cell lines, post treatment with 1 μM ola for 24 hrs. For each experiment, at least 50 spreads were analyzed per sample. Data are mean from two biologically independent experiments. Source data are provided.