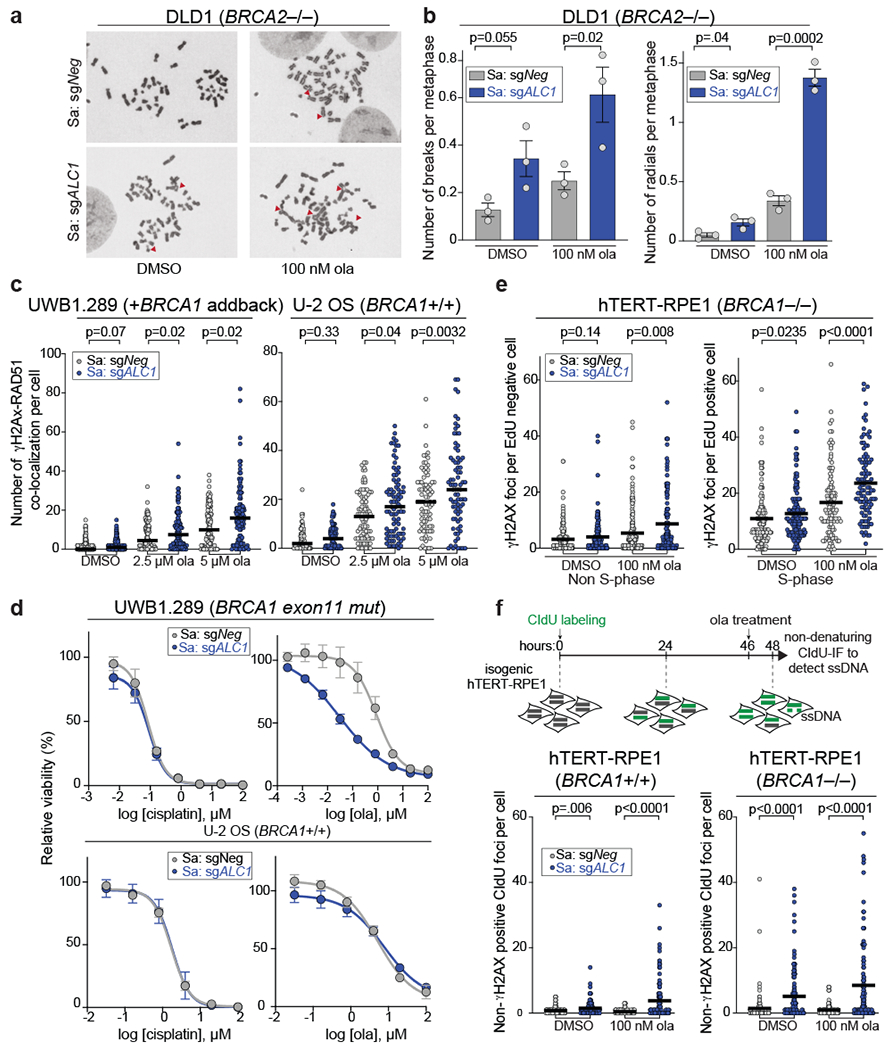
Fig. 4. Loss of ALC1 increases genomic instability.

a-b, Representative images (a) of the chromosomal aberrations (indicated by red arrow heads) and quantification (b) of breaks and radials per metaphase upon ALC1 depletion in DLD1 BRCA2−/− cells. Data are mean ± s.e.m. from n = three biologically independent experiments, p-value, unpaired t-test. For each experiment, at least 50 spreads were analyzed per sample. c, Quantification of γH2AX-RAD51 co-localization in indicated UWB1.289 + BRCA1 add back and U-2 OS cells. Median is indicated. p-value determined by Mann-Whitney was derived from n≥67 cells examined over two biologically independent experiments. d, Sensitivities of the indicated cell lines to cisplatin and ola as determined by CellTiter-Glo assay. Data are mean ± s.e.m. from n = three biologically independent experiments. e, Quantification of γH2AX foci in non-S-phase (left) and S-phase (right) cells. Median is indicated. p-value determined by Mann-Whitney was derived from n≥99 cells examined over two biologically independent experiments. f, Schematic and quantification of non-γH2AX positive CIdU foci in the indicated cell lines to specifically detect single strand (ss)-DNA that was not generated by end-resection at DSBs. Median is indicated. p-value determined by Mann-Whitney was derived from n≥105 cells sampled over two biologically independent experiments. Cells were incubated with the indicated concentrations of ola for either 2 hrs (f) or 24 hrs (b, c, e). Source data are provided.
