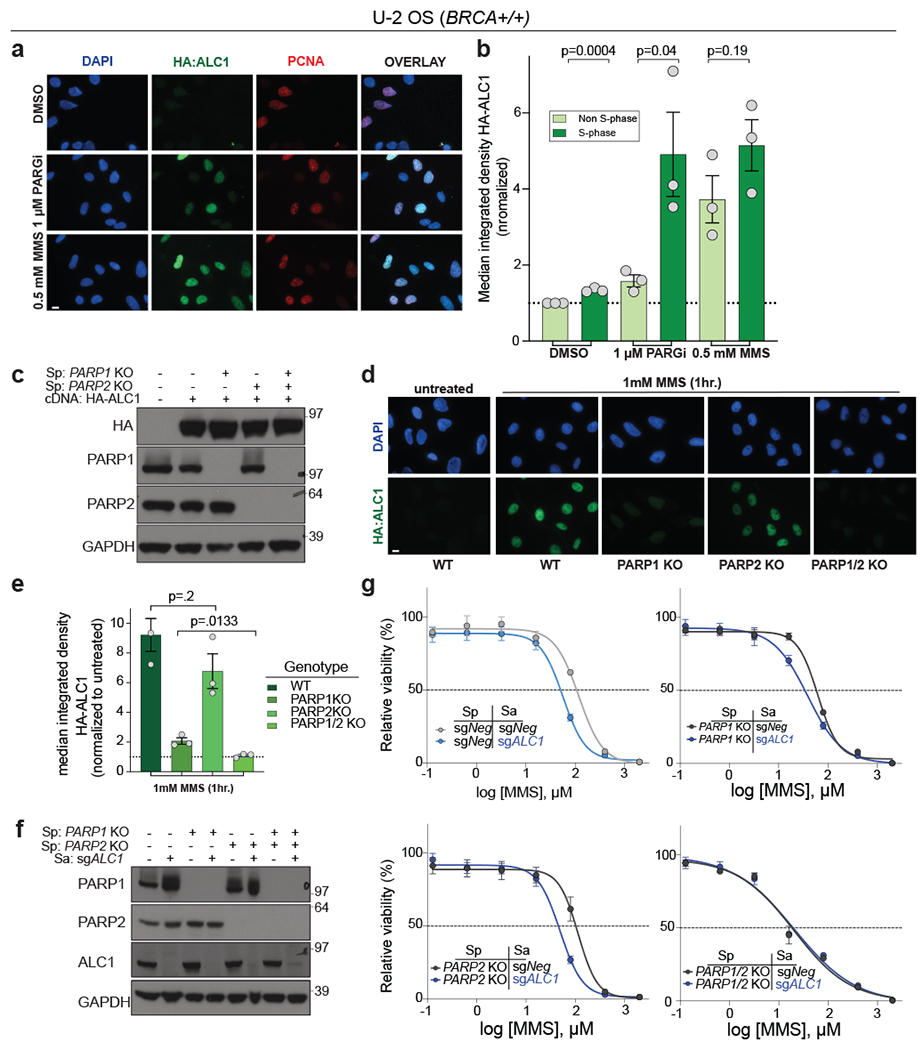
Fig. 6. ALC1 function in the DNA damage response requires PARP1 and PARP2.

a-b, Representative images (a) and quantification (b) of HA-ALC1 localization to chromatin upon the indicated treatments. Scale bar, 10 microns. The median value was normalized to non-S-phase untreated control. Data are mean ± s.e.m. from n= three biologically independent experiments. p-value, unpaired Student’s t-test. For each experiment, at least 50 cells were analyzed per sample. c, Immunoblot showing stable expression of HA-ALC1 in indicated cell lines. Samples were analyzed once to examine the level of overexpression prior to localization experiments. d-e, Representative images (d) and quantification (e) of HA-ALC1 localization to chromatin, scale bar 10 microns. For each cell line, the median value upon MMS treatment was normalized to its respective untreated control. Data are mean ± s.e.m. from n=three biologically independent experiments, p-value, unpaired Student’s t-test. For each experiment, at least 50 cells were analyzed per sample. f, Immunoblot showing depletion of ALC1 in the indicated cell lines. Consistent results were obtained across two independent blots. g, Sensitivities of the indicated U-2 OS lines to MMS in the CellTiter-Glo assay. Data are mean ± s.e.m. from n=three biologically independent experiments. Source data are provided.
