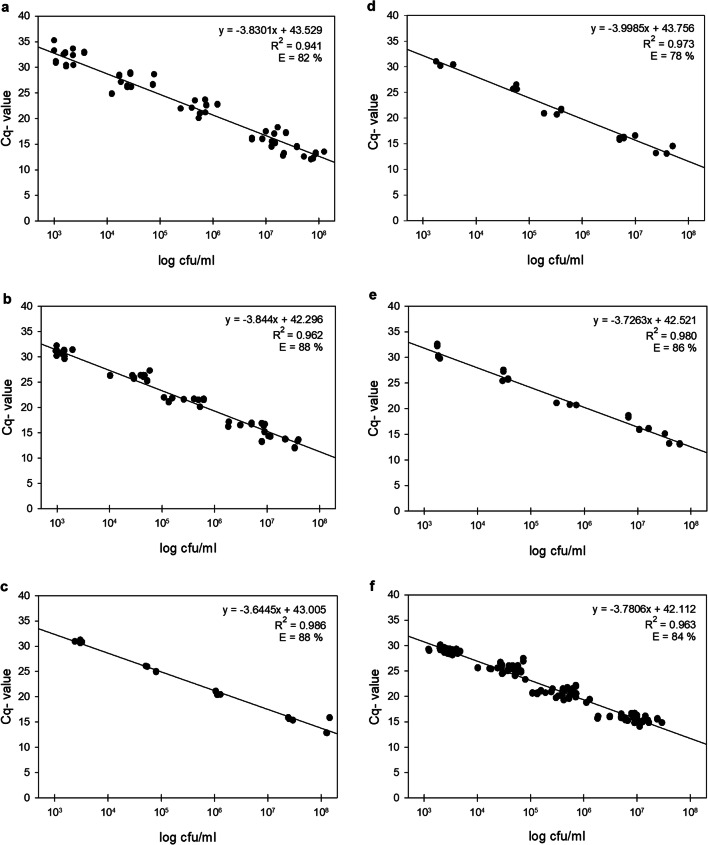
Fig. 2.
Standard curves of Cq values from multiplex qPCR using the six Pseudomonas probes P1–P6 (a–f), correlated with cell counts of artificially spiked raw milk samples. 26 representative target strains (9 strains for P1; 8 for P2; 3 for P3, P4 and P5; 26 for P6) were chosen, and cells were serially diluted in fresh raw milk (1:52–1:59). Cell counts of diluted samples were determined by cultivation, and in parallel, DNA of the milk samples was isolated and applied as templates in the two triplex qPCR assays. Averaged Cq values from two technical replicates of each strain were plotted against the respective Pseudomonas counts given in log cfu/ml. Regression equation, coefficient of determination (R2), and amplification efficiency (E) are given for each standard curve

