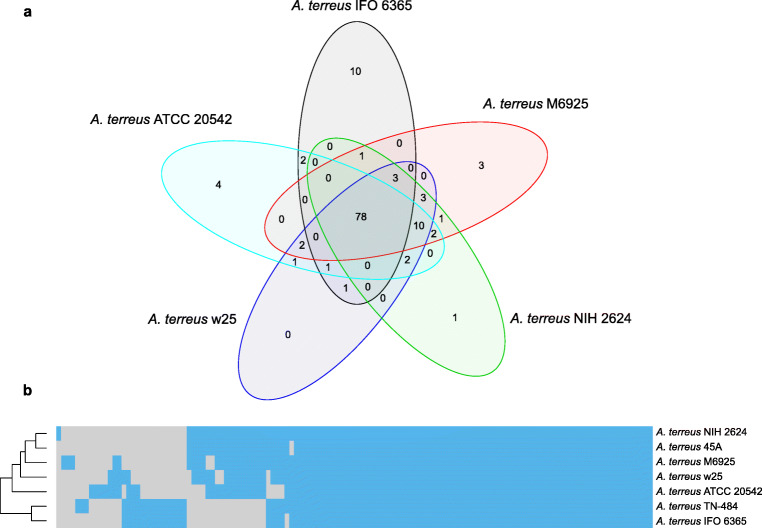
Fig. 3.
Comparison of the predicted secondary metabolism potential in A. terreus strains. a Venn diagram of SM proteins from 5 representative genomes of each clade. The representative genomes were selected based on the phylogenetic analysis and genome quality. b Clustering of the A. terreus strains based on presence (blue tiles)/absence (gray tiles) of orthologous core biosynthetic proteins involved in secondary metabolism predicted by antiSMASH in every genome. Dendrogram was generated based on hierarchical clustering analysis. Y-axis: strain clustering; x-axis: protein clustering (dendrogram and orthologous groups not shown). A. terreus T3 Kankrej was not included in the analysis due to unsatisfactory quality of its genome (high sequence fragmentation)

