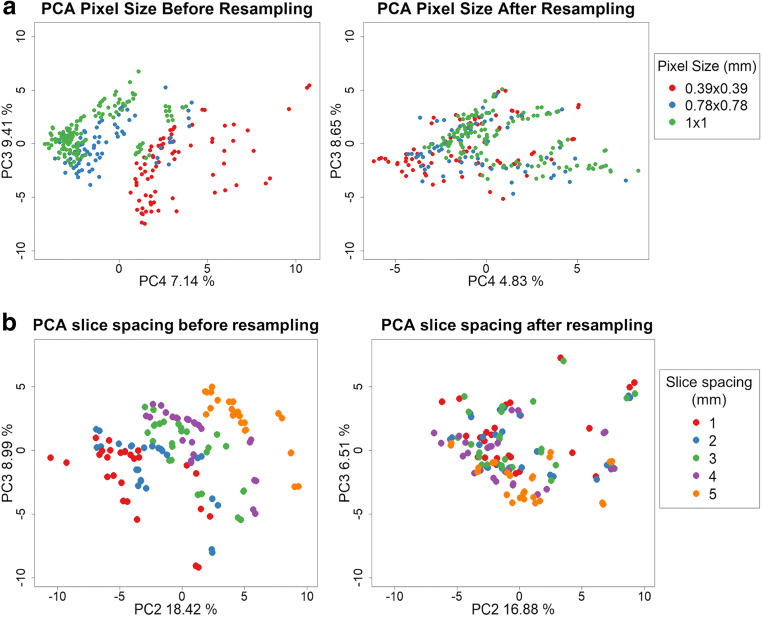
Fig. 4.
Principal component analysis (PCA) before and after resampling to 1 × 1 × 1 mm3 voxels of CT images acquired with different pixel sizes (a) and slice spacings (b). PC4 (explaining 7.14% of the radiomics data variance) is associated with the different acquisition pixel sizes before resampling. PC2 (18.42%) is associated with the distribution of the different acquisition pixel heights. After resampling, the acquisition voxel size (accounting for pixel size and slice spacing) is not associated with the variance explained by the PCA

