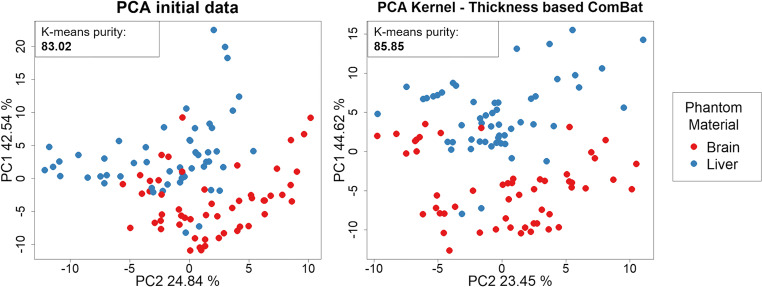
Fig. 5.
Principal component analysis (PCA) of the brain and liver material radiomics distribution before and after convolution kernel–slice thickness ComBat correction. The distance between the radiomics data of the brain and liver materials from CT scans with different acquisitions protocols increases after applying batch correction (i.e., the radiomics distribution better reflects differences between materials and not due to the CT-acquisition parameters)

