Fig. 7.
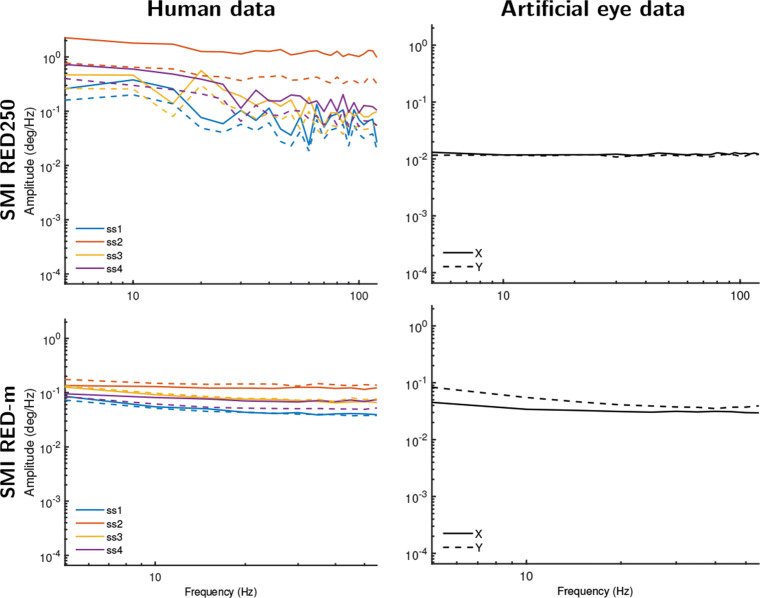
Amplitude spectra for gaze vector data from the SMI eye trackers. As not all filters could be turned off in the SMI RED systems, we instead analyzed the gaze vector data provided by these eye trackers for both human eyes (left column) and artificial eyes (right column). Except for the human data recorded on the SMI RED250, all gaze vector data exhibit white signal dynamics. The human gaze vector data on the SMI RED250 nonetheless exhibits amplitude spectra that are much less colored than the filtered gaze position data shown in Fig. 5. Different color lines denote different participants. Solid lines show amplitude spectra derived from horizontal gaze position data, and dotted lines for vertical gaze position data

