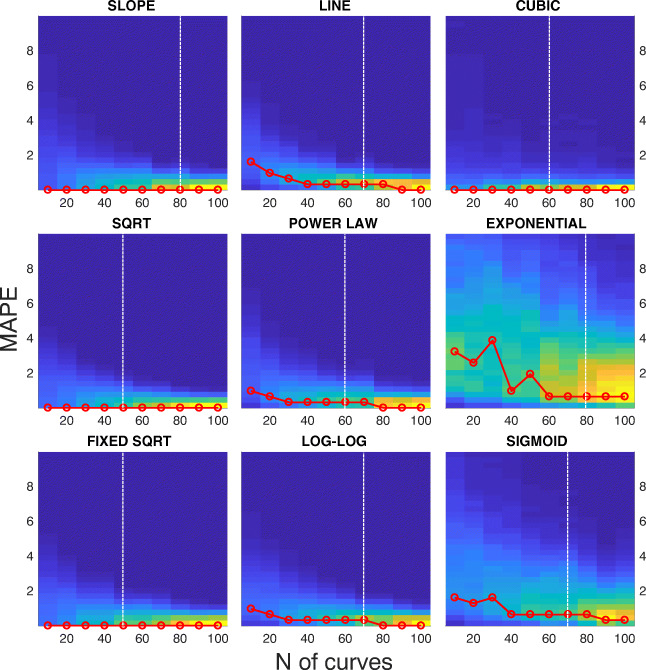
Fig. 7.
Distribution of the mean absolute percentage error (MAPE) at increasing sample size. Each panel shows the density distribution of the MAPE (y-axis). The MAPE is computed considering each possible coupling within the 1000 fitting of the bootstraps, for different sizes of the boot, from 10 to 100 samples (x-axis). Data are from SBJ1, Exp. 2.1. The red line represents the maximum of the distribution at each boot size. The white dashed vertical line represents the number of samples beyond which the parameter estimation does not statistically change

