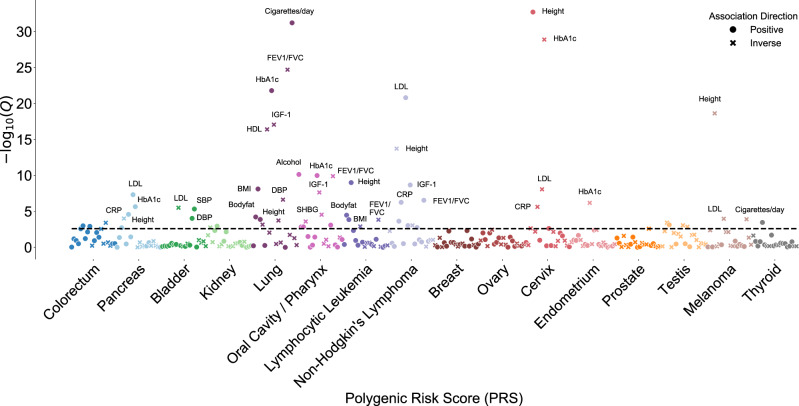
Fig. 3. Associations between each cancer-specific polygenic risk score (PRS) and 20 cancer risk factors and related serum biomarkers.
All associations were estimated in cancer-free controls in the UK Biobank. Circles denote positive associations between the PRS and the secondary phenotype; crosses denote an inverse direction of the association. Odds ratios (ever/never smoking status) were estimated from logistic regression models, and p values were calculated from two-sided Wald tests. Risk ratios (remaining phenotypes) were estimated from linear regression models, and p values were calculated from two-sided t tests. The dashed line indicates the significance threshold corrected for multiple testing (p < 0.05/20 = 0.0025).

