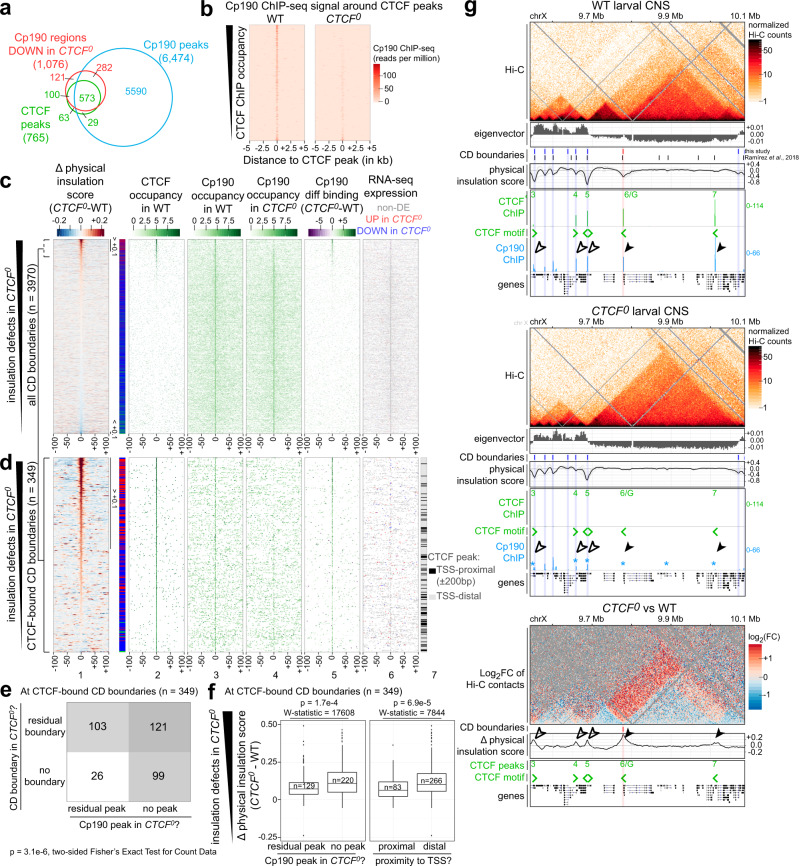
Fig. 5. CTCF recruits Cp190 to a subset of Cp190-bound domain boundaries.
a Overlap between CTCF (green) and Cp190 (blue) peaks in WT, and regions with reduced Cp190 binding in CTCF0 relative to WT (red). Some peaks were split for three-way comparisons (see “Methods”). b Cp190 ChIP-seq signal in WT or CTCF0 around CTCF peaks, ranked by CTCF occupancy in WT. c Distribution of indicated datasets around CD boundaries defined in any genotype (n = 3970 boundaries) ranked by insulation defects in CTCF0. (1) Insulation score differences in CTCF0 minus WT. Visibly weaker boundaries in CTCF0 (score > +0.1) or in WT (score < −0.1) are bracketed. On the right, boundaries are classified as in Fig. 2d. (2–4) ChIP occupancy of CTCF peaks in WT, Cp190 peaks in WT or Cp190 peaks in CTCF0. (5) Differential Cp190 ChIP occupancy in CTCF0 minus WT. (6) Expressed TSSs in WT and CTCF0 with similar (gray), increased (red) or decreased (blue) expression in CTCF0 relative to WT. d As above for CD boundaries with a CTCF peak within ±2 kb (n = 349 boundaries) centered on the closest CTCF peak classified as TSS-proximal (within ±200 bp of a TSS) or distal (lane 7). e Numbers of CD boundaries bound by CTCF in WT (n = 349 boundaries) that are present or absent in CTCF0 mutants, and whose associated CTCF peak overlaps or not a residual Cp190 peak in CTCF0 mutants (p-val = 3.1e−6, two-sided Fisher’s Exact Test for Count Data). f Physical insulation score differences in CTCF0 minus WT at CTCF-bound CD boundaries (n = 349 boundaries) are higher when the associated CTCF peak does not overlap a residual Cp190 peak in CTCF0 mutants, or a TSS within 200 bp (indicated p values and W-statistics from two-sided Wilcoxon rank-sum test with continuity correction). Box plot: center line, median; box limits, upper and lower quartiles; whiskers, 1.5× interquartile ranges; points, outliers; n = CTCF peaks of each category (in x). g Example locus like Fig. 2c also displaying Cp190 ChIP-seq signal in WT and CTCF0 mutant larval CNSs. Asterisks mark Cp190 peaks in CTCF0 mutants with reduced occupancy relative to WT revealed by differential analysis. Solid arrowheads mark strictly CTCF-dependent boundaries (the second boundary was not called by TopDom), empty arrowheads mark partially CTCF-dependent boundaries.

