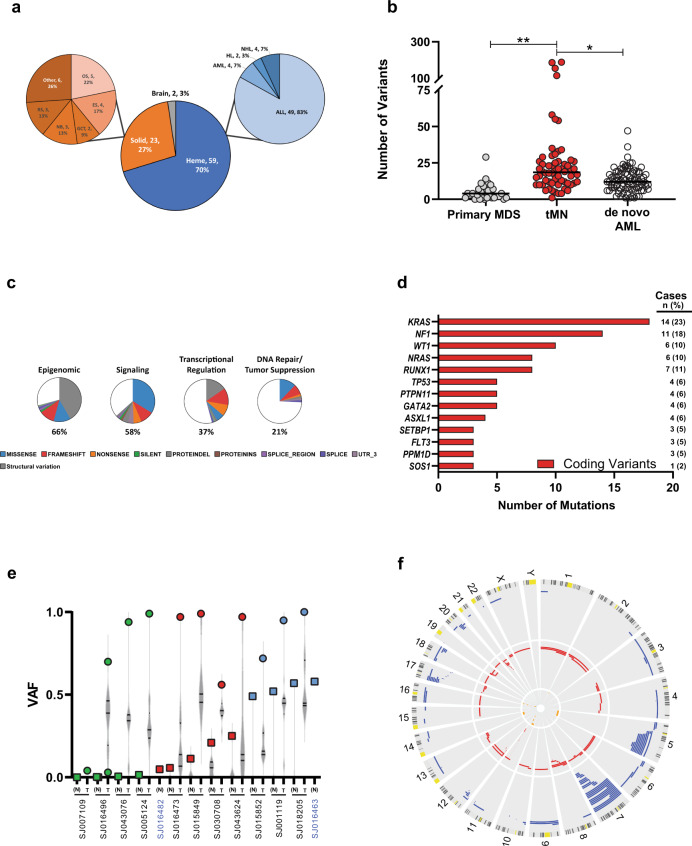
Fig. 1. Clinical and genomic features of the pediatric tMN cohort.
a Pie charts depicting the distribution of initial diagnoses within the pediatric tMN cohort. AML acute myeloid leukemia, HL Hodgkin lymphoma, NHL non-Hodgkin lymphoma, ALL acute lymphoblastic leukemia, OS osteosarcoma, ES Ewing sarcoma, GCT germ cell tumor, NB neuroblastoma, RS rhabdomyosarcoma, Other includes: embryonal sarcoma, Wilms tumor, rhabdoid tumor, ovarian carcinoma, and peripheral neuroepithelioma. b Total number of somatic mutations per patient (includes the following mutation types: silent, nonsense, frameshift, indel, splice site, ITD, RNA coding genes, 3′ and 5′ UTR) compared to pediatric primary MDS16 and de novo AML17.*p < 0.001; **p < 0.0001. Black bar indicates the median. Wilcoxon–Mann–Whitney non-parametric, two-tailed test used to compare biologically independent samples from n = 62 tMN, n = 32 primary MDS, and n = 87 de novo AML cases. c Pie charts showing the distribution of recurrently mutated pathways in the pediatric tMN cohort and the distribution of mutation types within each pathway. Percentages refer to the frequency of mutations within a pathway amongst all somatic mutations present in the cohort. d The genes most frequently mutated (somatic) in pediatric tMN—Only coding variants are shown. e VAF plot showing the 13 patients with TP53 mutations (SNV or indel). Tumor (T; circles) and normal (N; squares) are shown for each unique patient. Green symbols denote cases with VAFs suggesting somatic variants, blue symbols denote cases with clear germline variants in the normal tissue, and red symbols denote cases with TP53 mosaicism. *p < 0.01 for binomial mosaicism test. Violin plots represent the range of VAFs for all somatic variants in that case. Black bars indicate the median and upper and lower quartiles. Note: SJ016482 and SJ016463 are from the normal only group of patients (blue font). f Circos plot showing copy number alterations found via WES (n = 58) & WGS (n = 4) analysis of 62 tumor/normal pairs. Circumferential numbers indicate chromosome number, blue lines = deletions, red lines = amplifications, and orange lines = CN-LOH.

