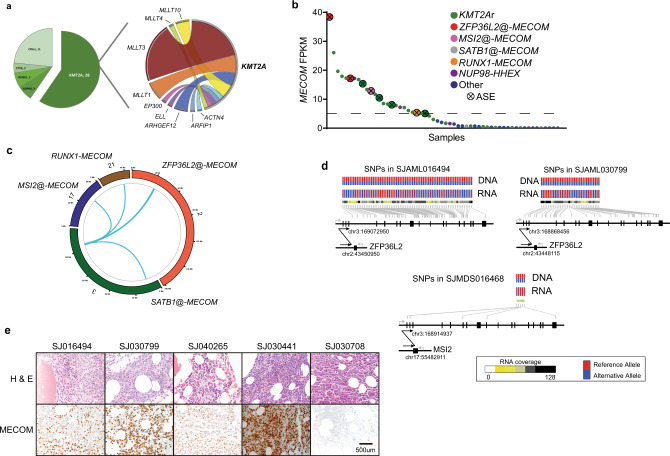
Fig. 3. Structural variations and MECOM dysregulation in pediatric tMN.
a Pie chart showing the distribution of in-frame fusions (n = 47) found in the pediatric tMN cohort (left). Ribbon plot showing the KMT2A binding partners found in pediatric tMN (right). The weight of the ribbon correlates to the frequency of the fusion. b MECOM FPKM plot for cases with RNA-Seq (n = 56). Dashed line indicates the level above which cases were classified as MECOMHigh. ASE allele specific expression. c Circos plot indicting the MECOM SVs found in the pediatric tMN cohort. Chromosome number and specific SV is listed around outside of ring. d Allele-specific RNA expression resulting from structural variants50. Heterozygous SNPs (genomic positions indicated by gray lines; red: reference allele; blue: alternative allele) detected in tumor DNA exhibited mono-allelic expression in tumor RNA. Structural alterations are indicated by arrows with breakpoints listed. Sequencing depth for each SNP in RNA-Seq are indicated as a heatmap. e Photomicrographs of bone marrow core biopsy of 4 cases with high MECOM expression (right panels: MECOM (Evi-1) IHC: 1C50E12, Cell Signaling Technology, dilution: 1:500) and a control case (SJ030708) with low/absent MECOM expression. Immunohistochemistry was performed once on the patient material available. All images are at equal magnification (20x).

