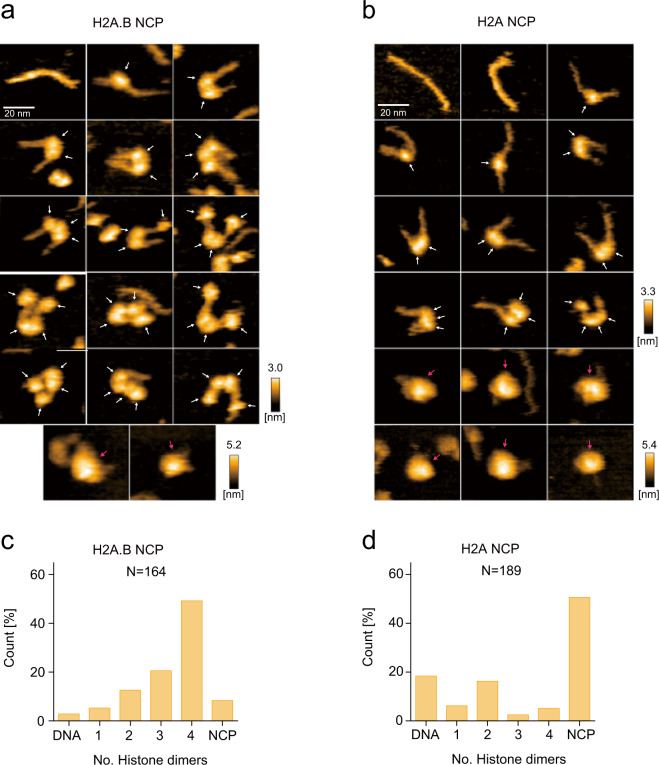
Fig. 3. HS-AFM analyses of the NCPs containing H2A.B and H2A.
a, b Initial HS-AFM images of the H2A.B NCP (a) and the H2A NCP (b). Individual particles are presented in the panels. White and magenta arrows indicate possible histone dimers and octamers, respectively. Scale bars are 20 nm. c, d The numbers of histone dimers in individual particles of the H2A.B NCP (c) and the H2A NCP (d) were counted and plotted. N indicates the total number of the counted particles. The source data for HS-AFM analysis are shown in Supplementary Data 1.

