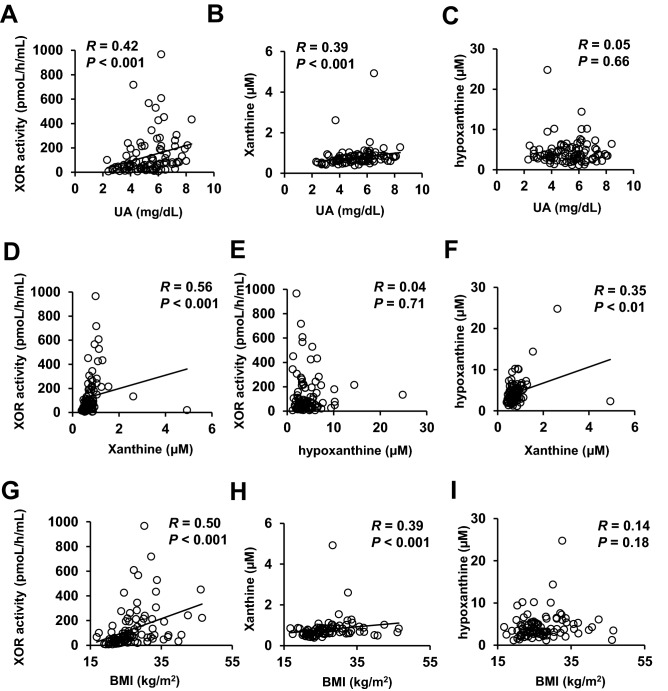
Figure 1.
Correlations among the plasma XOR activity and plasma levels of xanthine and hypoxanthine. (A) Correlation between the plasma XOR activity (pmol/h/mL) and serum uric acid level. (B) Correlation between the plasma xanthine concentration (µM) and serum uric acid level (mg/dL). (C) Correlation between the plasma hypoxanthine concentration (µM) and serum uric acid level (mg/dL). (D) Correlation between the plasma XOR activity (pmol/h/mL) and plasma xanthine concentration (µM). (E) Correlation between the plasma XOR activity (pmol/h/mL) and plasma hypoxanthine concentration (µM). (F) Correlation between the plasma xanthine concentration (µM) and plasma hypoxanthine concentration (µM). (G) Correlation between the plasma XOR activity (pmol/h/mL) and BMI (kg/m2). (H) Correlation between the plasma xanthine concentration (µM) and BMI (kg/m2). (I) Correlation between the plasma hypoxanthine concentration (µM) and BMI (kg/m2).

