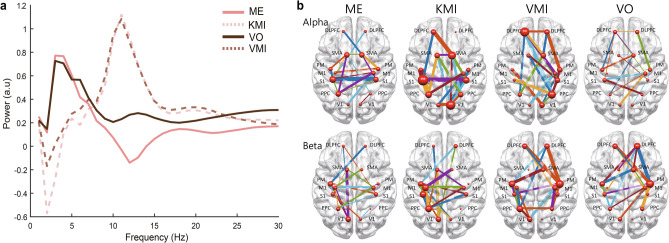
Figure 3.
An example of the features for classifying the KMI and VMI. (a) The Grand averaged power spectra of the four conditions. Each line indicates the normalized power for each condition grand averaged across all subjects and ROIs. For the further classification of KMI and VMI, we used the single trial-normalized power for the features (a.u arbitrary unit). (b) Grand averaged Highest 20% connections (as SVM features) at each frequency bands for each condition. The edges represent the functional connectivity calculated by the mutual information, and the thickness of the edge indicates the strength of the connectivity. The nodes represent the locations of the ROIs, and the different sizes of the node express the DC, that is, how many links are connected to that node.

