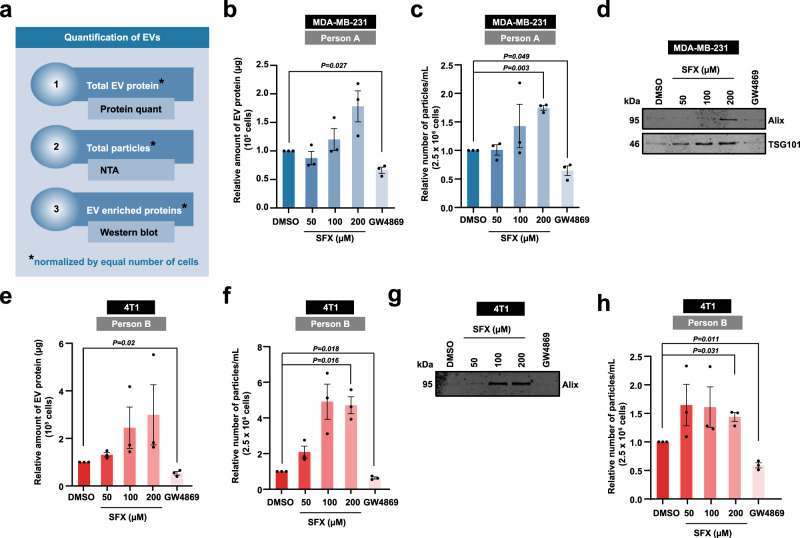
Fig. 2. Quantification of EVs released by cells with or without SFX and GW4869.
a Schematic of EV quantification by three different methods. Firstly, the total EV protein amount was quantified and normalised to equal number of live cells. Secondly, nanoparticle tracking analysis (NTA) was performed to quantify the total number of particles normalised to equal number of live cells. Lastly, Western blot analysis of EV samples obtained from equal number of live cells was performed for EV enriched proteins. b Relative amount of EV protein normalised to 105 MDA-MB-231 cells is shown. c Relative number of particles normalised to 2.5 × 10⁶ MDA-MB-231 cells is depicted. d Western blot analysis of EV enriched proteins Alix and TSG101 in EV samples obtained from 15 × 106 MDA-MB-231 cells. Representative image shown, n = 3 biologically independent experiments. e Relative amount of EV protein normalised to 105 4T1 cells is shown. f Relative number of particles normalised to 2.5 × 10⁶ 4T1 cells is depicted. g Western blot analysis of EV enriched proteins Alix in EV samples obtained from 15 × 106 4T1 cells. Representative image shown, n = 3 biologically independent experiments. h Relative number of particles normalised to 2.5 × 10⁶ 4T1 cells is depicted. All data are represented as mean ± s.e.m. n = 3 biologically independent experiments, statistical significance was determined by paired two-tailed t-test. EVs were isolated by protocol 1 (b–g) and 2 (h). Full uncropped images for western blotting is provided in Supplementary Fig. 1.

