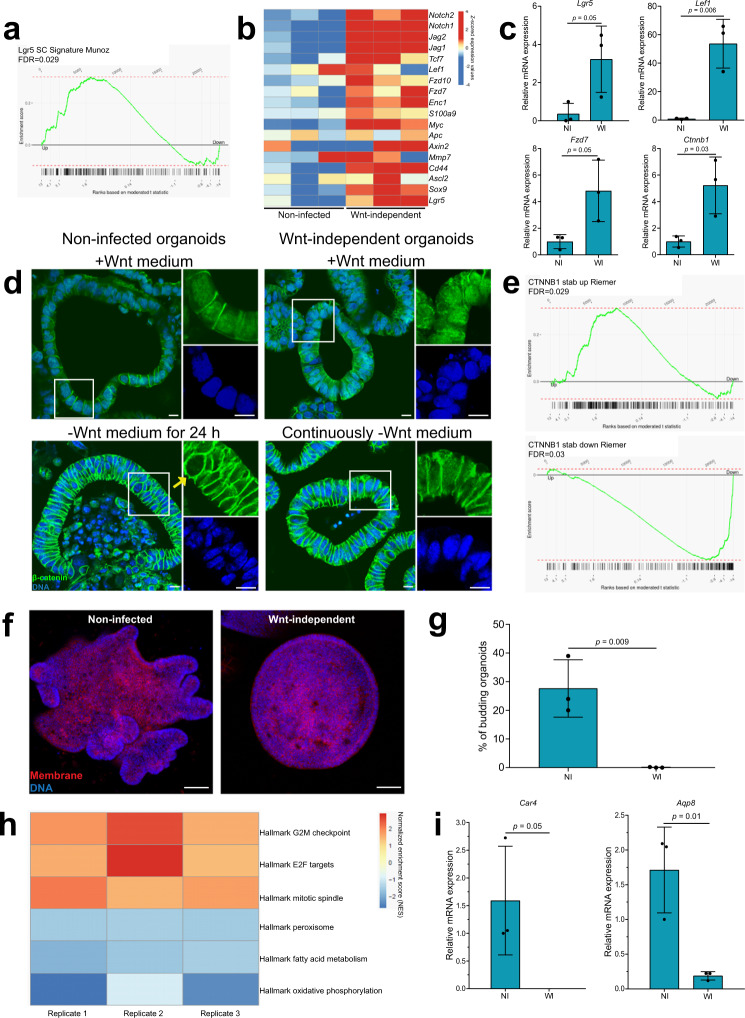
Fig. 3. Wnt-independent organoids show upregulated Wnt/β-catenin signaling and downregulation of differentiation genes.
a Global comparison using gene set enrichment analysis between intestinal stem cell genes31, and RNA sequencing results from three replicates. Genes are ordered according to their differential expression in Wnt-independent vs. non-infected samples from left to right. Intestinal stem cell genes are marked by black bars below the plot. Plot line shows the running enrichment score. b Wnt-independent organoids have a higher expression of Wnt target genes when compared to respective non-infected conditions. Data are mean-centered and averaged expression values for each replicate (n = 3) and condition. c RT-qPCR data showing expression of Lgr5, Lef1, Fzd7, and β-catenin (Ctnnb1) relative to Gapdh from three independent replicates. Data represent mean ± SD, p < 0.05, as calculated by two-sided unpaired Student’s t-test. NI = non-infected and WI = Wnt-independent. d Immunostaining for β-catenin (green) in non-infected and Wnt-independent organoids. Upon removal of Wnt from the medium for 24 h, non-infected organoids show the absence of nuclear β-catenin (marked by the yellow arrow). DAPI (blue) stains for DNA. Image representative of three independent replicates. Scale bars: 10 μm. e Global comparison using gene set enrichment analysis between genes upregulated and downregulated during activated β-catenin signaling32, and RNA sequencing results from three replicates. Genes are ordered according to their differential expression in Wnt-independent vs. non-infected samples from left to right. Genes are marked by black bars below the plot. Plot line shows the running enrichment score. f Immunofluorescence image of a single organoid on day 7 after seeding. Image representative of three independent replicates. Scale bars: 100 μm. g Bar graph of the percentage of differentiated organoids from three replicates on day 7 after seeding. >90 organoids counted per condition for each replicate. Data represent mean ± SD, p < 0.05, as calculated by two-sided unpaired Student’s t-test. NI = non-infected and WI = Wnt-independent. h Hallmark genes associated with mitosis (Hallmark G2M checkpoint, Hallmark E2F targets, and Hallmark mitotic spindle gene sets) are enriched among upregulated genes, and hallmark genes associated with differentiation (Hallmark peroxisome, Hallmark fatty acid metabolism, and Hallmark oxidative phosphorylation gene sets) are enriched among downregulated genes in all three replicates of Wnt-independent organoids when compared to non-infected organoids. Normalized enrichment score (NES) for a given gene set is the enrichment score normalized to mean of the enrichment scores for all data set permutations. Results are significant (FDR < 20%), except for Hallmark oxidative phosphorylation of replicate 2. i RT-qPCR data showing expression of Car4 and Aqp8 relative to Gapdh from three independent replicates. Data represent mean ± SD, p < 0.05, as calculated by two-sided unpaired Student’s t-test. NI = non-infected and WI = Wnt-independent. Source data are provided as a Source Data file.

