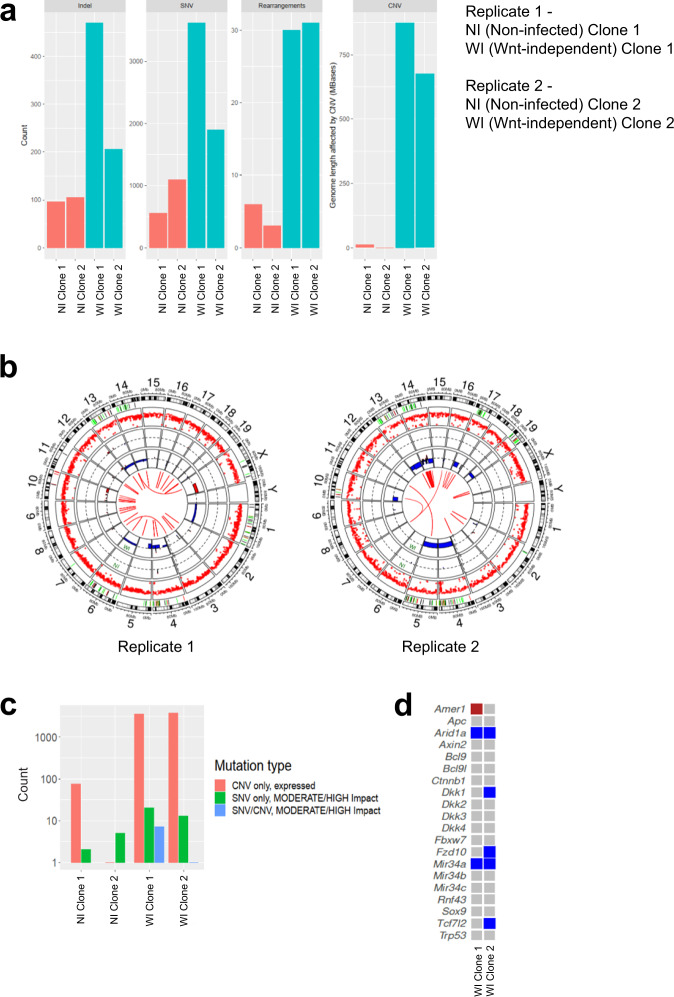
Fig. 4. Wnt-independent organoids have major chromosomal aberrations and high mutational load.
a The number of detected insertions and deletions (indels), somatic single nucleotide variants (SNV), and detected rearrangement breakpoints (Rearrangements) in Wnt-independent (WI) and non-infected (NI) organoids in two independent replicates from whole-genome sequencing (WGS). Genome length affected by copy number variations (CNV) for Wnt-independent (WI) and non-infected (NI) organoids in two independent replicates from WGS. Each condition was compared to the pool of non-infected organoids of that respective experiment. b Circos plots showing CNV, SNV, indels, structural variants, and mutated genes in the Wnt-independent organoids for replicates 1 and 2 from WGS. Each section represents chromosomes 1–19, chromosome X, and chromosome Y. The central part shows aberrant genomic fusions in the Wnt-independent condition. The two innermost circles (WI and NI) represent CNV in non-infected (NI) organoid clones and Wnt-independent (WI) organoid clones, respectively. The blue (genomic loss) and red (genomic gain) regions represent CNV. All losses of chromosomal regions are heterozygous. Each condition was compared to all the non-infected organoids of that respective replicate. A rainfall plot (red dots) shows the SNV and indel variations and the distances between them on the y-axis only for the Wnt-independent condition. The green, orange, and black lines depict positions of mutated Wnt pathway genes, known cancer driver genes, and p53 pathway genes, respectively, in the Wnt-independent condition. c The number of genes affected in each sample by CNV and/or SNV analyzed by WGS. For CNV, only genes expressed in non-infected controls were considered. For SNV, only mutations that change the amino acid sequence are shown. d Mutational status of genes of the Wnt pathway that are frequently affected in CRC, genes of the micro-RNA-34 family, and Trp53. Blue, genomic loss; red, genomic gain. Source data are provided as a Source Data file.

