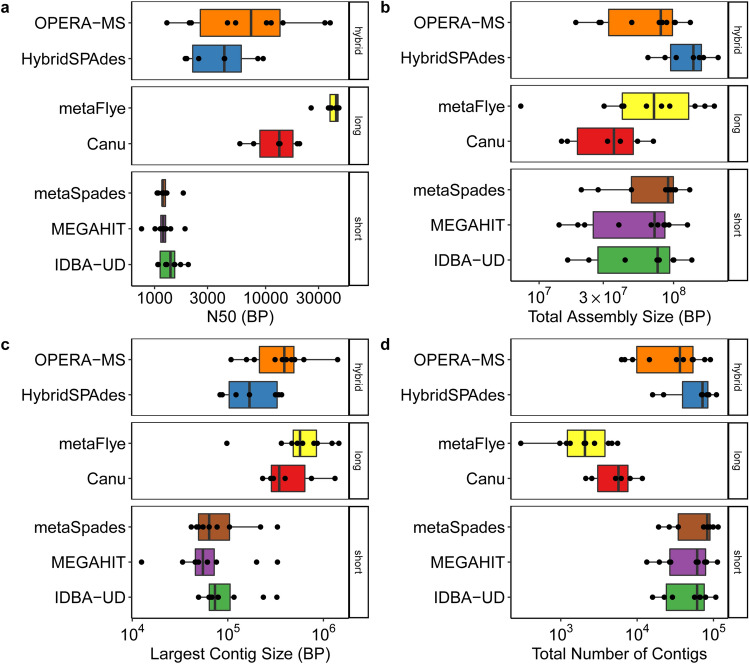
Figure 1.
Descriptive assembly metrics for short, long, and hybrid read assemblies, where each point represents one of the ten samples assessed. The box inner line represents the median while the whiskers represent the 25th and 75th percentiles. (a) N50 of contig lengths. (b) Total assembly size in basepairs. (c) Largest contig size in basepairs. (d) Total number of contigs produced. This figure was generated using the ggplot2(v3.3.0) package in R(v3.5.0).

