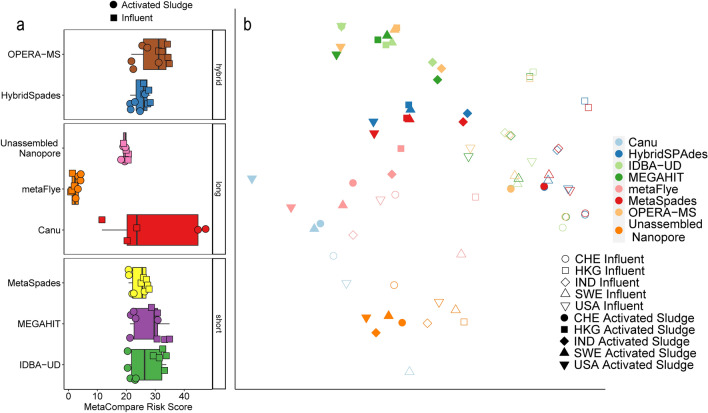
Figure 2.
(a) Boxplot of MetaCompare risk scores by individual sample, where influent is represented as squares and activated sludge is represented as circles. The box inner line represents the median while the whiskers represent the 25th and 75th percentiles. (b) NMDS plot of annotated of ARGs, MGEs, and pathogen gene marker profiles underlying MetaCompare risk scores. Where CHE Switzerland, HKG Hong Kong, IND India, SWE Sweden, USA United States of America. Assembler type, treatment stage and sample were significant factors in system clustering (ANOSIM; R = 0.26, p = 0.001; R = 0.26, p = 0.001; R = 0.33, p = 0.001). This figure was generated using the ggplot2(v3.3.0) package in R(v3.5.0).

