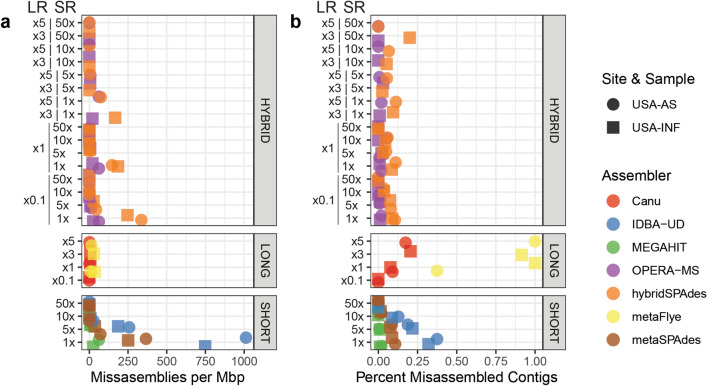
Figure 4.
Assembler performance in assembling the in silico spiked genome of Marinobacter hydrocarbonoclasticus ATCC 49840 into two metagenomic samples (where circles represent USA-AS and squares represent USA-Inf). (a) Misassemblies per million basepairs within contigs aligning to the M. hydrocarbonoclasticus ATCC 8 genome. (b) Ratio of contigs with misassemblies to total contigs aligning to the M. hydrocarbonoclasticus genome. Y-axis indicates sequencing coverage, reported as long by short read coverages for hybrid assemblers. Hybrid assembly coverage is labeled with the long-read coverage by short-read coverage. This figure was generated using the ggplot2(v3.3.0) package in R(v3.5.0).

