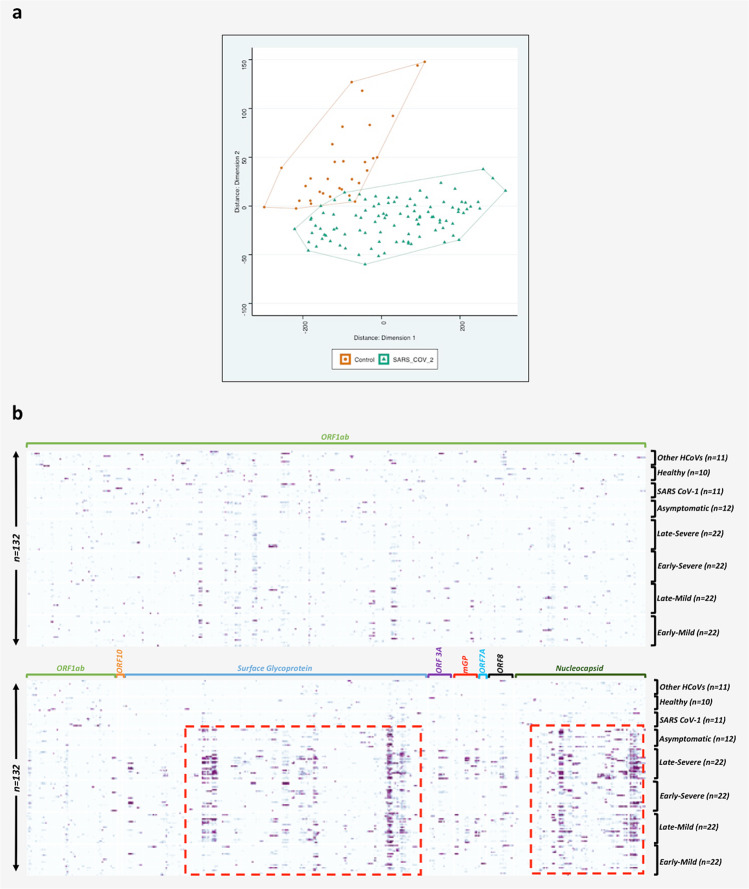
Fig. 1. Multidimensional scaling (MDS) of differential IgG peptide signals and heatmap showing differential peptide signals throughout SARS-CoV-2 proteome.
a Multidimensional scaling (MDS) of differential IgG peptide signals in assays of sera from subjects with a history of infection with SARS-CoV-2 (n = 100) or without historical exposure to SARS-CoV-2 (controls) (n = 32). Based on MDS analysis, samples with exposure of SARS-CoV-2 samples (green) versus controls (red) clustered into two separate groups. b Proteome-wide linear epitope mapping of SARS-CoV-2-specific IgG antibodies by a HCoV peptide array. X axis represents 981 peptides from SARS-CoV-2 proteins, Y axis represents 132 samples tested using the HCoV peptide array. Heatmap is plotted with normalized values of individual peptide intensity in AU for each of the 132 plasma samples. Panel grids show highly reactive areas in S and N proteins. *ORF1ab protein is large so divided partly in lower panel owing to larger size.

