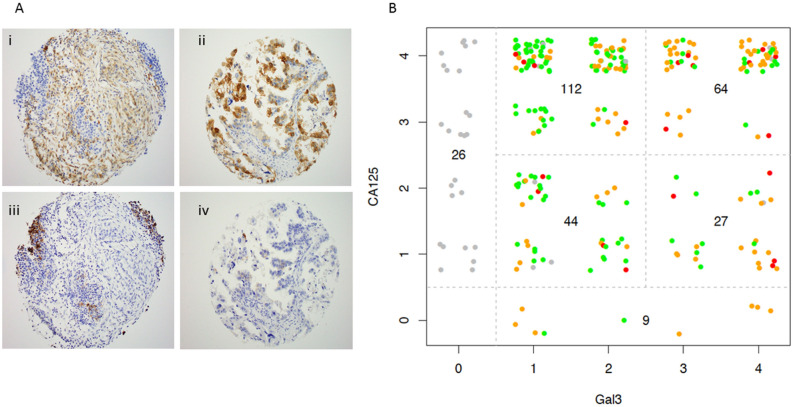
Figure 1.
Expression of LGALS3 and CA125 (MUC16) in human ovarian cancers. Three anonymized human tissue microarrays were constructed by collecting 1–3 cores from paraffin embedded, fixed blocks, as previously described27. (A) Examples of human tumor cores stained for CA125 (panel i) and Gal3 (panel ii). Examples of core that did not stain for CA125 (panel iv) and tumor that did not stain for Gal3 (panel iii). (B) Each core was qualitatively scored for prevalence of CA125 and Gal3 positive cells (0 = < 5%, 1 + = 5–25%; 2 + = 25–50%; 3 + = 50–75% and 4 + = > 75%. The intensity for Gal3 was separately scored as low, medium and high (represented by green, orange and red dots respectively). All cores were independently scored by a blinded reference pathologist (KP).

