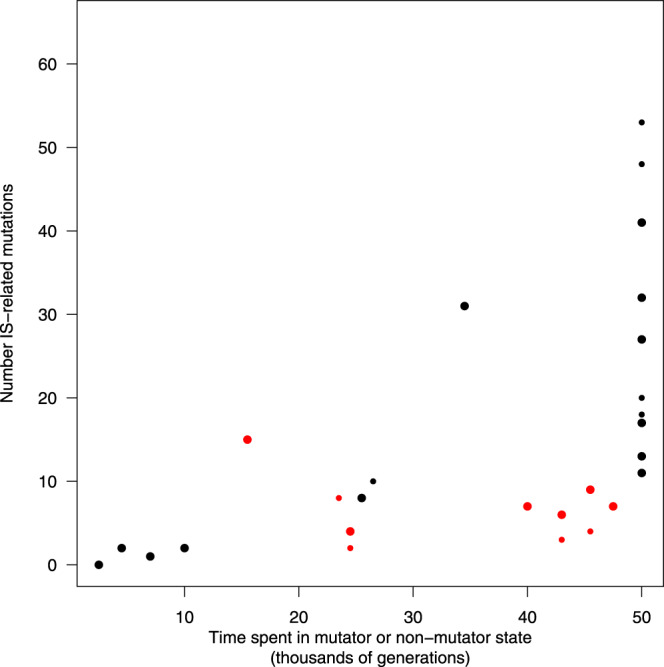
Fig. 4. Number of fixed IS-related mutations as a function of a lineage’s time spent in mutator or non-mutator state.

Large and small dots show mutations fixed in major and minor lineages, respectively. (Both include mutations fixed in the total population, so they are not fully independent). Red and black dots indicate mutator and non-mutator populations, respectively; the y-axis values show the number of IS-related mutations that were fixed over the time spent in either the mutator or non-mutator state. Source data are provided as a Source Data file.
