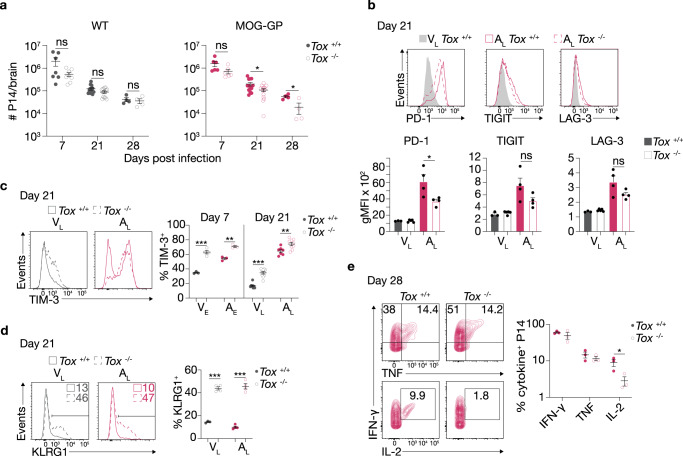
Fig. 3. TOX is required for self-reactive CD8+ T-cell persistence.
104 naive Tox+/+ or Tox−/− P14 cells were adoptively transferred into WT and MOG-GP mice. One day later (day 0), mice were challenged i.c. with 104 PFU rLCMV-GP33. Brain infiltrating P14 cells were isolated for flow cytometric analysis at indicated days post infection (a–e). a Flow cytometric enumeration of CNS infiltrating P14 cells at days 7 (Tox+/+ P14 cells in WT mice, n = 7, Tox−/− P14 cells in WT mice, n = 8, p = 0.0739; Tox+/+ P14 cells in MOG-GP mice, n = 6, Tox−/− P14 cells in MOG-GP mice, n = 6, p = 0.0822), 21 (Tox+/+ P14 cells in WT mice, n = 13, Tox−/− P14 cells in WT mice, n = 14, p = 0.0618; Tox+/+ P14 cells in MOG-GP mice, n = 13, Tox−/− P14 cells in MOG-GP mice, n = 14, p = 0.0210), and 28 (Tox+/+ P14 cells in WT mice, n = 4, Tox−/− P14 cells in WT mice, n = 4, p = 0.6420; Tox+/+ P14 cells in MOG-GP mice, n = 4, Tox−/− P14 cells in MOG-GP mice, n = 4, p = 0.0217) post infection. b Flow cytometric analysis of inhibitory receptor expression in Tox+/+ VL (n = 3 mice), Tox−/− VL (n = 5 mice), Tox+/+ AL (n = 4 mice), and Tox−/− AL (n = 4 mice). PD-1, p = 0.0345; TIGIT, p = 0.1007; LAG-3, p = 0.0997. Representative flow cytometry histograms (above) and summary data (below). c Frequency of TIM-3-expressing cells in VE (Tox+/+, n = 3; Tox−/−, n = 4; p = 0.0002), AE (Tox+/+, n = 3; Tox−/−, n = 3; p = 0.0013), VL (Tox+/+, n = 8; Tox−/−, n = 10; p < 0.0001), and AL (Tox+/+, n = 7; Tox−/−, n = 9; p = 0.0079). Representative flow cytometry histograms (left) and summary data (right). d Frequency of KLRG1-expressing cells in VL (Tox+/+, n = 3; Tox−/−, n = 4; p < 0.0001) and AL (Tox+/+, n = 4; Tox−/−, n = 4; p < 0.0001). Representative flow cytometry histograms (left) and summary data (right). e Intracellular staining for IFN-γ (p = 0.3681), TNF (p = 0.374), and IL-2 (p = 0.0436) in Tox+/+ and Tox−/− AL cells at day 28 post infection after in vitro stimulation with KAVYNFATC peptide. Numbers indicate the frequency of cytokine-producing cells within each quadrant. Representative flow cytometry plots (left) and summary data (right) (n = 3 mice/group). ns, not significant; *p ≤ 0.05; **p ≤ 0.01; ***p ≤ 0.001 (two-tailed unpaired t test for a–e). Data represent the pool of two independent experiments (a and c) or are representative of at least two independent experiments (b, d, and e). Bars and horizontal lines represent mean ± SEM. Source data are provided as a Source data file.

