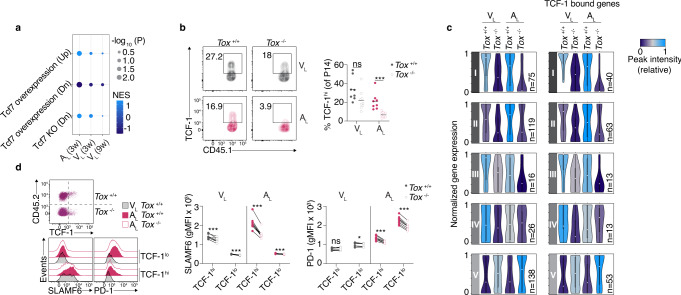
Fig. 6. TOX predominantly preserves the pool of self-reactive TCF-1hi CD8+ T cells.
104 naive Tox+/+ or Tox−/− P14 cells were adoptively transferred into WT and MOG-GP mice. One day later (day 0), mice were challenged i.c. with 104 PFU rLCMV-GP33 and brain infiltrating P14 cells were FACS sorted for RNA-seq (a and c), ATAC-seq (c) and flow cytometric analysis (b) at indicated days post infection. a GSEA of TCF-1 specific signatures27 in a ranked list of genes differentially expressed by Tox+/+ vs. Tox−/− AL and VL at indicated time points. NES: normalized enrichment score. b Frequency of TCF-1-expressing cells in VL (Tox+/+, n = 8; Tox−/−, n = 9; p = 0.0554) and AL (Tox+/+, n = 8; Tox−/−, n = 9; p = 0.0004) cells 21 days after infection. Representative flow cytometry plot (left) and summary data (right). Horizontal lines represent the mean. c Violin plots illustrating normalized expression of genes found proximal to differentially accessible ChARs (maximum distance to gene = 100 kb) for each module as defined in Fig. 4d. The bounds of the boxes indicate the 25th and 75th percentiles, the center (dot) reflects the median, the lower whisker indicates the minimum, and the upper indicates the maximum of normalized gene expression and violin colors indicate the average peak intensity of ChAR-gene pairs within each module (module I, n = 75; module II, n = 119; module III, n = 16; module IV, n = 26; module V, n = 138). Genes showing at least one TCF-1 binding event are depicted within each module (module I, n = 40; module II, n = 63; module III, n = 13 module IV, n = 13; module V, n = 53). d Congenically distinct naive Tox+/+ and Tox−/− P14 cells were mixed 1:1 and adoptively transferred into WT and MOG-GP mice. One day later (day 0), mice were challenged i.c. with 104 PFU rLCMV-GP33 and brain infiltrating P14 cells were isolated for flow cytometric analysis 21 days later. SLAMF6 and PD-1 expression stratified in TCF-1hi and TCF-1lo subsets in VL (n = 7 mice) and AL cells (n = 8 mice). Gating strategy and representative flow cytometry histograms (left) and summary data (right). SLAMF6 (VL TCF-1hi, p = 0.0007; VL TCF-1lo, p = 0.0001; AL TCF-1hi, p < 0.0001; AL TCF-1lo, p < 0.0001); PD-1 (VL TCF-1hi, p = 0.5355; VL TCF-1lo, p = 0.0113; AL TCF-1hi, p < 0.0001; AL TCF-1lo, p < 0.0001). ns, not significant; *p ≤ 0.05; ***p ≤ 0.001 (two-tailed unpaired t test for (b) and two-tailed paired t test for (d)). Data represent the pool of two independent experiments (b) or are representative of at least two independent experiments (d). Source data are provided as a Source data file.

