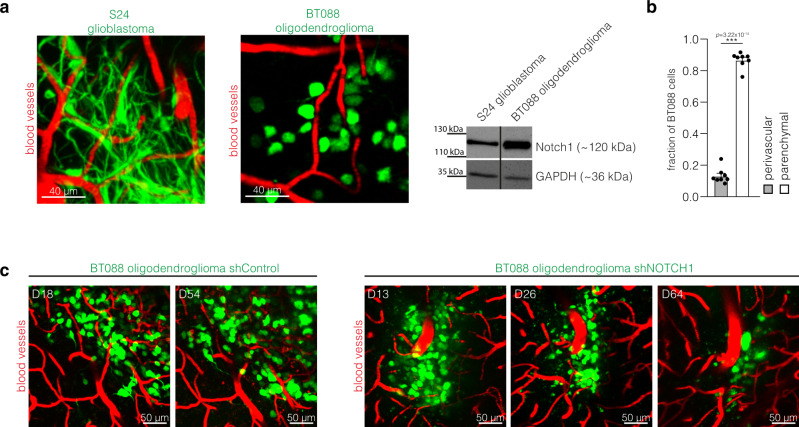
Fig. 7. NOTCH1 pathway activation in TM-deficient oligodendrogliomas.
a Left: Exemplary intravital 2-PM images of S24 glioblastoma and BT088 oligodendroglioma cells (D21 after tumor implantation). Right: Western blot analysis of the Notch1 expression in S24 glioblastoma stem-like cells (GBMSCs) and BT088 oligodendroglioma cells. Loading control: GAPDH. b Quantification of the distribution of BT088 oligodendroglioma cells in the perivascular and parenchymal compartment (n = 8 regions in 5 mice, D21 ± 3, two-tailed t-test). c Exemplary images of BT088 shControl oligodendroglioma cells and BT088 shNOTCH1 cells demonstrate tumor regression after NOTCH1 knockdown. Data b are represented as mean + SEM. ***p < 0.001.

