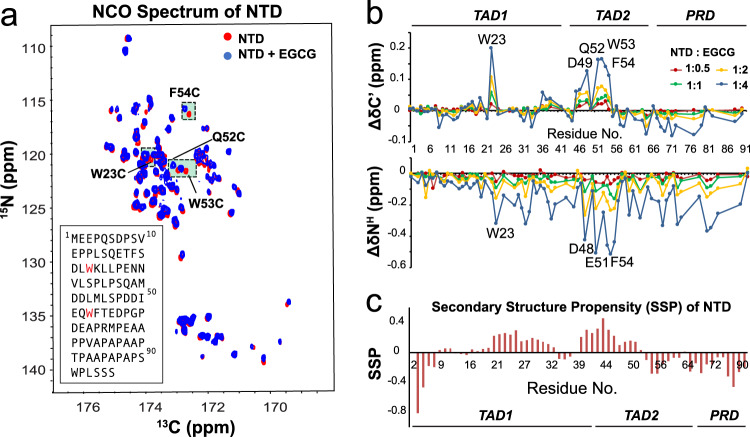
Fig. 2. 15N–13C NCO titration of p53 NTD with EGCG.
a Overlay of 15N–13C NCO spectra of 0.3 mM p53 NTD, apo (red) and in the presence 1.2 mM EGCG (blue). b CSPs of carbonyl carbon (C’) and amide nitrogen (NH) of p53 NTD (0.3 mM) titrated with EGCG, at NTD:EGCG ratios of 1:0.5 (red), 1:1 (green), 1:2 (yellow), and 1:4 (blue). Residues with largest CSPs were marked by residue type and number. Source data are provided as a Source Data file. c Secondary structure propensity (SSP) of p53 NTD. An SSP score of 1 or −1 reflects fully formed α-helix or β-sheet structure, while a score of ~0.5 or ~−0.5 indicates significant propensity for α-helix or β-sheet, respectively. Source data are provided as a Source Data file.

