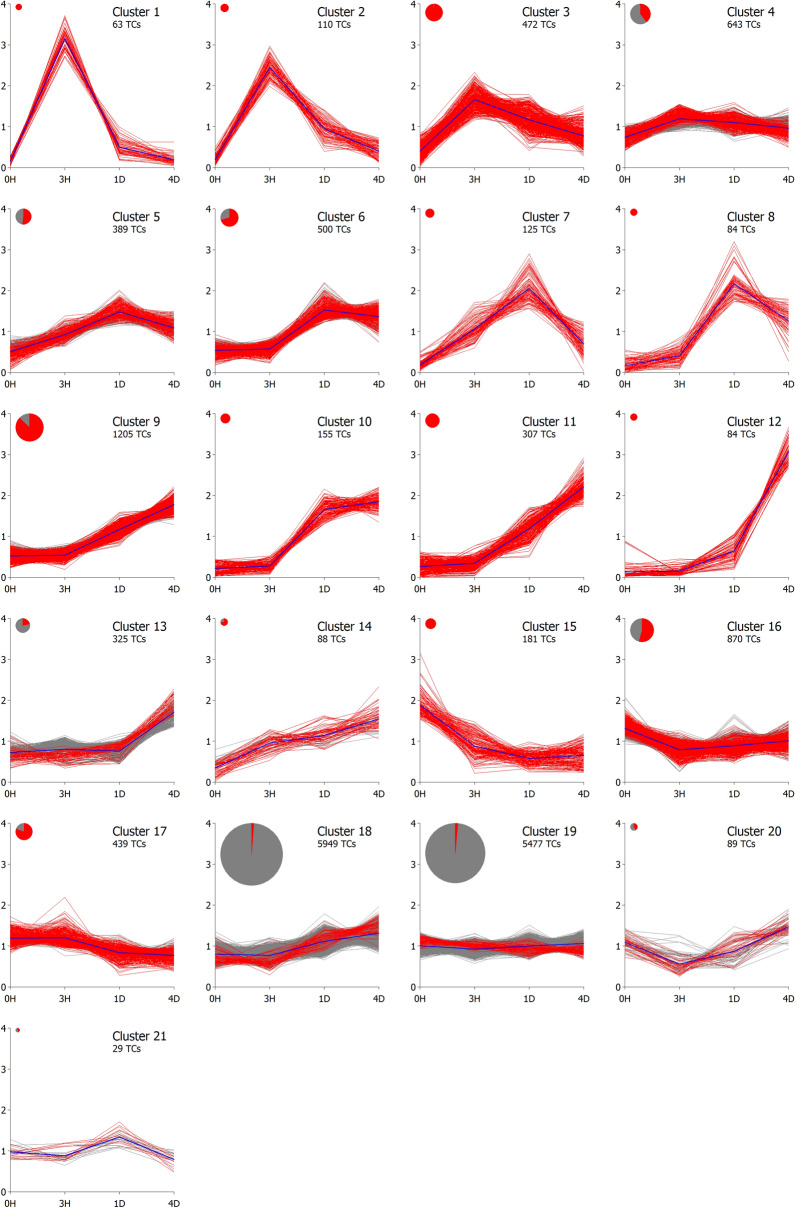
Figure 2.
Expression profiles of transcripts in pine seedlings after wounding of the stem, grouped by the Bayesian hierarchical clustering algorithm SplineCluster40. All 17,584 Pinus EST transcripts that achieved at least eight CPM in at least four libraries are shown. The statistically differentially expressed transcripts (FDR < 0.05) at 3 h, 24 h or 96 h after wounding, compared to the control, are shown in red. The area of the disk shown for each cluster is proportional to the number of TCs in the cluster. 0H, control; 3H, 3 h; 1D, 24 h; 4D, 96 h.

