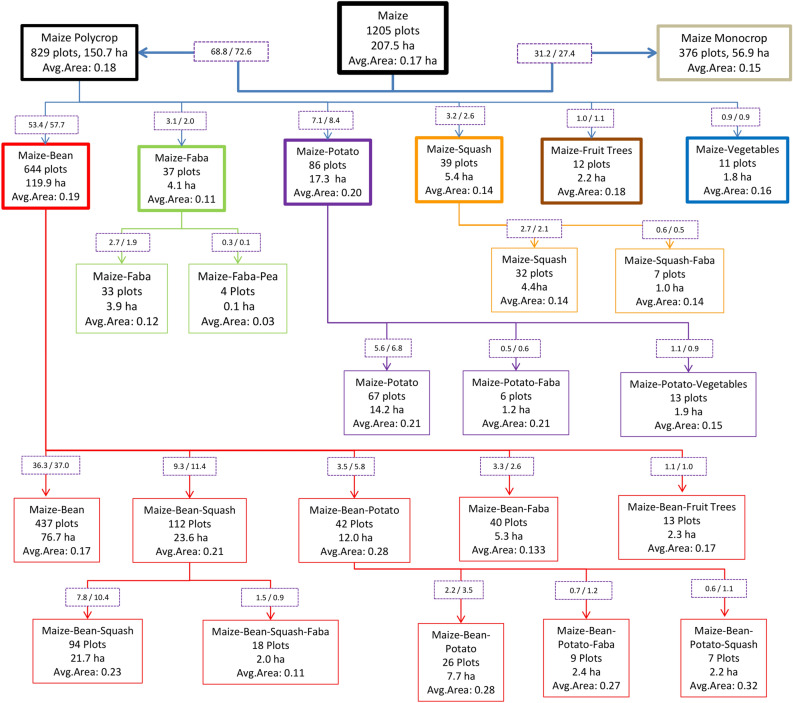
Figure 2.
Maize plots reported in the survey of farm households in the Western Highlands of Guatemala. Milpa systems and their varied crop combinations are represented in different colours. The tree is nested, so the first node displays all maize plots, with successive splits for monocrop vs intercropped maize and with crop names presented according to how often they were grown (overall: maize > common beans > potatoes > squash > faba beans > fruit trees > vegetables). Numbers in the boxes superimposed on the arrows are the percentages, of number of plots and area under the respective milpa system, of the total 1 205 maize plots.

