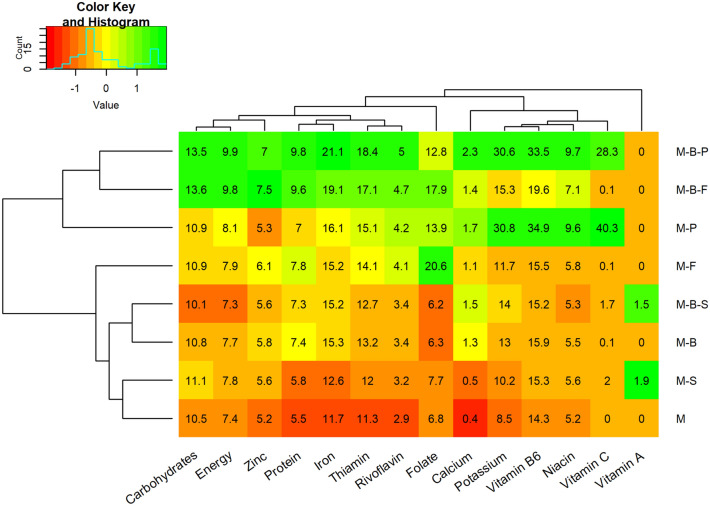
Figure 5.
Heatmap showing the Potential Number of People Fed (PNPF) per ha per year (numbers in the cells) considering the recommended daily allowances for key human nutrients, for a range of milpa systems in the Western Highlands of Guatemala. Crop associations codes are: M-P: Maize-Potato, M-B-S: Maize-Bean-Squash, M-B-P: Maize-Bean-Potato, M-B: Maize-Bean, M-F: Maize-Faba, M: Maize monocrop, M-S: Maize-Squash, M-B-F: Maize-Bean-Faba. The colour-code denotes a gradient (of scaled PNPF values) from high PNPF in green to low PNPF in red, crop associations and nutrients are clustered in a dendrogram (in black to the left and top respectively) according to the PNPF values (Created using heatmap.2 function from the R package gplots -http://cran.r-project.org/web/packages/gplots/index.html).

