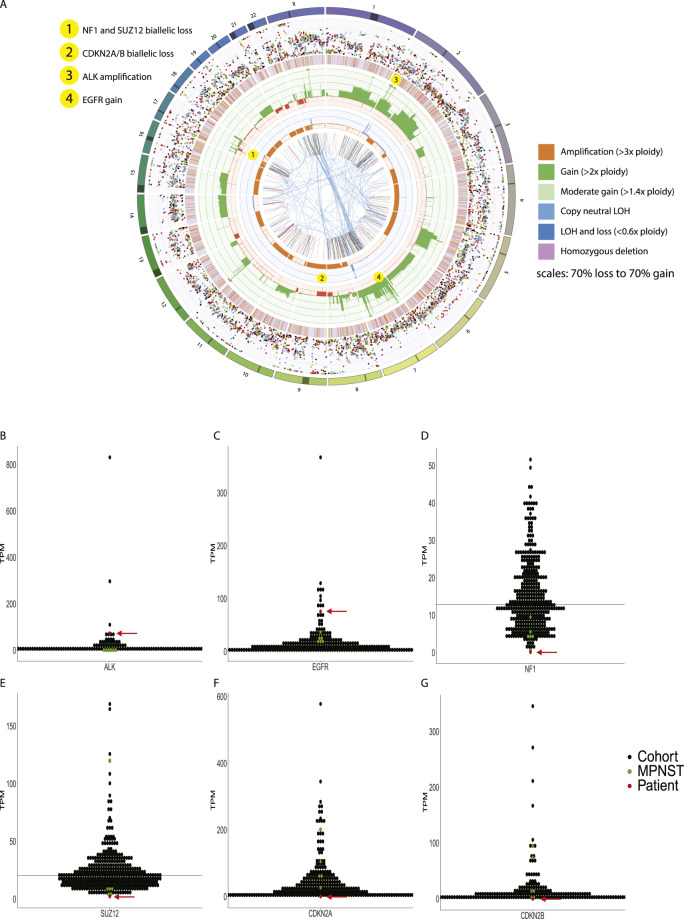
Fig. 1. Results of genomic profiling.
A Circos plot illustrating complex genomic profile. Outermost circle: chromosomes; Second circle: purity-adjusted allelic frequency of all observed somatic SNV, colored according to its Cosmic signature (http://cancer.sanger.ac.uk/cosmic/signatures); Third circle: small (<50 bp) insertions (yellow) and deletions; Fourth circle: copy number changes, including deletions45 and amplifications. If the absolute copy number is >6, it is shown as 6 with a green dot; the fifth circle: minor allele copy number, where the loss of heterozygosity is shown in orange and amplification of the minor allele shown in blue. Innermost circle: structural variants with translocations in blue, deletions in red, insertions in yellow, tandem duplications in green, and inversions in black. B–G RNA abundance was assessed for ALK, EGFR, NF1, SUZ12, CDKN2A, and CDKN2B using RNAseq and represented as transcripts per million (TPM). The red dot and arrow represent this case, relative to n = 5 unrelated MPNST tumors and n = 133 high-risk pediatric tumors from the PRISM cohort (black).

