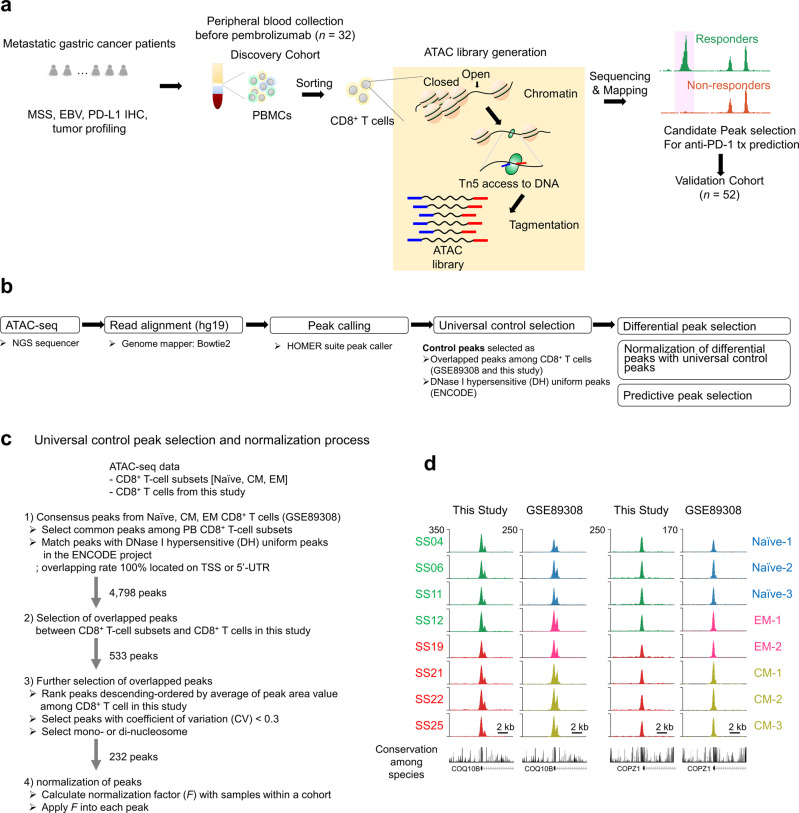
Fig. 2. Outline of assay for transposase-accessible chromatin using sequencing (ATAC-seq)-based molecular diagnosis and peak selection processes.
a To identify biomarkers that can predict the benefits of anti-PD-1 therapy, we processed PBMCs from patients with mGC by generating an ATAC library and performing deep sequencing. The transposition reaction resulted in fragmented genomic DNA; transposons were inserted by Tn5 transposases into open and accessible chromatins. Following ATAC library sequencing and mapping to the human genome, genome-wide analysis revealed differences between responders and non-responders to anti-PD-1 therapy. MSS: microsatellite stability; EBV: Epstein–Barr virus; PD-L1: programmed death-ligand 1; IHC: immunohistochemistry. b After ATAC library generation, each library pool was quantified using a Bioanalyzer and sequenced on a single lane of the NextSeq 500 system using 75-bp single reads. Sequencing read (fastq) files were mapped using the human genome database (hg19) and Bowtie v. 2.0 software. Further analysis was performed in two stages: (1) control peak selection to identify consensus peaks among CD8+ T-cell subsets known as DNase I hypersensitive (DH) sites, followed by normalization of peaks from each patient using control peaks; and (2) predictive peak selection to distinguish response and non-response to anti-PD-1 therapy after normalization of the selected differential peaks. NGS: next generation sequencing; hg: human genome. c Universal control peak selection and normalization. After peak calling, universal control selection was performed to identify consensus peaks as normalization controls. In total, 4,798 consensus assays were matched for transposase-accessible chromatin (ATAC) peaks among previously studied CD8+ T-cell subsets with DNase I hypersensitive (DH) uniform peaks from the ENCODE project; these peaks were located on transcriptional start site (TSS) or 5’-untranslated regions (UTR). In addition, 533 consensus ATAC peaks were detected in ATAC-seq CD8+ T-cell data used in this study. To identify accurate normalization controls among selected consensus ATAC peaks, the coefficient of variation (CV; i.e., the ratio of the standard deviation [SD] to the mean) was used to define the extent of ATAC peak variability among samples and peaks with mono- and di-nucleosome patterns. First, the area of the peak was calculated using the area of base pairs within the range of the peak; these areas were used to calculate CV values for each peak. In total, 232 ATAC peaks were detected which satisfied two criteria: low variance (CV < 0.3) and uniqueness of peak width (< 500 bp). Notably, the top 20 peaks in terms of average peak area were highly evolutionarily conserved among 17 species; these peaks, which could be useful for genomic studies of other species, were used to calculate the within-cohort normalization factor (F). PB: peripheral blood; EM: effector memory; CM: central memory. d Two representative control peaks shown in a genome browser. Conservation levels among 17 species are shown at the bottom of the corresponding peak. The y-axis shows read counts.

