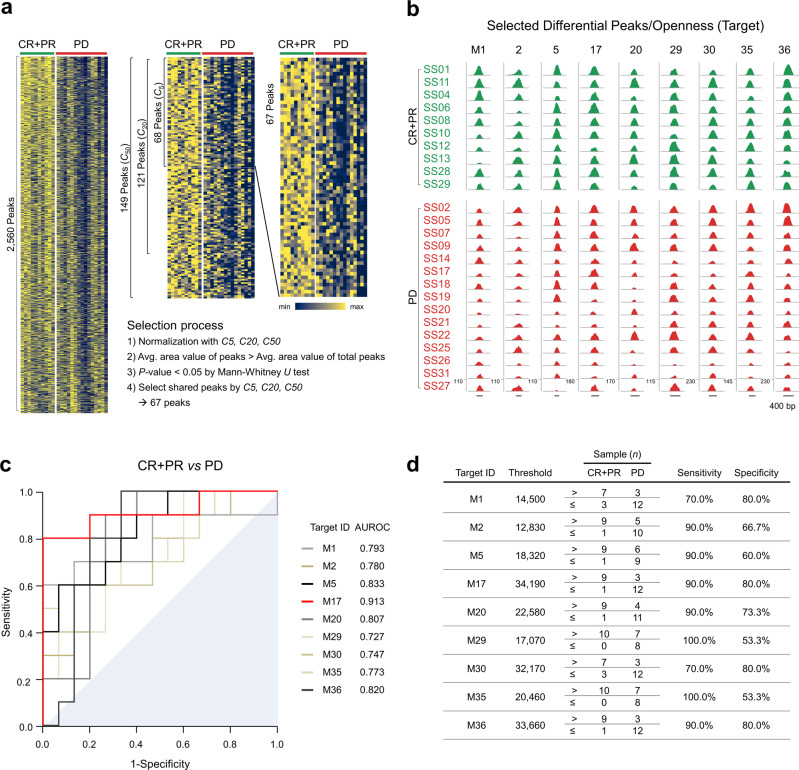
Fig. 3. Selection of control and differential peaks, followed by normalization.
a We selected 2,560 differential peaks that distinguished between a responder group (complete response plus partial response, CR + PR) and a non-responder group (progressive disease, PD) using three peak callers: the HOMER suite, MACS2, and CisGenome. These peaks were normalized by control peaks (Supplementary data 1), then subjected to selection procedures. Chromatin accessibility heatmaps with normalized peak area values by 20 controls (rows) and patients (columns) were displayed as a representative. C5, C20 and C50 indicate 5 controls, 20 controls and 50 controls, respectively. Peaks were ranked by relative distance between the two groups as described in Methods. Relative minimum and maximum area values are indicated in navy and yellow, respectively. b Genome browser tracks show nine differential peaks (i.e., openness) as targets in a responder group (CR + PR, green) and a non-responder group (PD, red). Numbers above each peak denote target IDs. The y-axis shows the adjusted read count, calculated using a normalization factor (F). Scale bar indicates 400 base pairs (bp) of nucleotides. c Receiver operating characteristic (ROC) curves for the nine targets in the discovery cohort. Adjacent are target IDs with the areas under the ROCs (AUROCs) of the nine targets. The area under the diagonal reference line is filled. d Determination of threshold values for the nine targets. Target IDs are arranged in descending order of relative mean difference between responder (CR + PR) and non-responder (PD) groups. For each target, the threshold value indicates the optimized guideline calculated by the online Cutoff Finder tool, allowing prediction of response to anti-PD-1 therapy. Responders and non-responders were counted as the number of samples above or below the threshold, respectively, to determine sensitivity and specificity.

